

Translate this page into:
Effect of changes in the intravascular volume during hemodialysis on blood viscoelasticity
This is an open-access article distributed under the terms of the Creative Commons Attribution-Noncommercial-Share Alike 3.0 Unported, which permits unrestricted use, distribution, and reproduction in any medium, provided the original work is properly cited.
This article was originally published by Medknow Publications and was migrated to Scientific Scholar after the change of Publisher.
Abstract
Adoption of high rate of ultrafiltration (UF) during hemodialysis (HD) may affect the hemorhelogical blood profile, by changing Hematocrit (Hct) and the concentration of plasma proteins, which may in turn interfere with tissue perfusion. The aim of this work is to examine the effect of acute volume change during dialysis on the hemorheological variables. The study included 21 hemodialysis patients. Hematocrit (Hct) and percent decrease in blood volume (BV) were recorded by blood volume monitor. Blood samples were taken before and at the end of dialysis, for measuring plasma fibrinogen and haemorheological variables, which included blood viscosity, plasma viscosity, red cells elasticity and aggregation. The UF volume was 3.52±1.54 L. Hct increased from 34.2±6.1 to 42.1±7.3% (P<0.001), and blood volume (BV) decreased to 85.5±6.4% (P<0.001). Blood and plasma viscosity significantly increased from 3.28±0.69 to 5.48±0.85 mPa.s (P<0.001), and from 1.24 ± 0.16 to 1.65±0.24 mPa.s (P<0.001), respectively. Changes in plasma viscosity were correlated to changes in plasma fibrinogen (r=0.63, P<0.05), while the increase in blood viscosity was correlated to the percent reduction in blood volume (r=0.85, P<0.005). Red cells elasticity increased from 0.26±0.12 to 0.48±0.18 mPa.s (P<0.05), and the aggregation index rose from 0.86±0.31 to 1.25±0.26 (P<0.01). This combination of increased plasma viscosity and red cell aggregability may lower the velocity of erythrocyte transfer inside the tissue capillaries after HD, which may affect tissue perfusion. Moreover, increased elasticity may require more energy from the heart to disaggregate the cells, and this may induce problems in the patients with cardiac dysfunction. In conclusion, the hemorheological variables change after dialysis in the direction which may impede the flow inside the microvessels.
Keywords
Blood elasticity
fibrinogen
hematocrit
hemodialysis
hemorheology

Introduction
The heart delivers energy to the blood with each heart beat, part of which is dissipated through viscosity, part is stored in the elastic structure of the artery, and part is stored in the kinetic mass of blood.[1] Early investigator conceptualized blood as a viscous fluid, assuming that the viscosity controls its flow property.[2] However, blood is not a fluid in the ordinary sense; it is a fluidized suspension of red cells, which have a viscoelastic property traceable to the elastic red blood cells, which occupy about half the blood volume. When the red cells are at rest, they tend to aggregate and stack together in a space-efficient manner. In order for blood to flow freely, the size of these aggregates must be reduced.[3] The forces that disaggregate the cells produce elastic deformation and orientation of these cells, causing elastic energy to be stored in the cellular microstructure of the blood. As flow proceeds, the sliding of the internal cellular structures requires a continuous input of energy, which is dissipated through viscous friction. These effects make blood a viscoelastic fluid, exhibiting both viscous and elastic properties. Failure to disaggregate, deform, or both results in impaired perfusion of the tissues’ capillary beds.[4]
Blood is a non-Newtonian fluid that responds by modifying its viscosity on application of different shear stresses.[5] At low shear rates, (<100 per s) human blood displays high viscosity while at high shear rates (>200 per s) human blood displays a lower viscosity.
During a single dialysis session, several liters of fluid, sometimes exceeding the total plasma volume, may be removed by ultrafiltration.[6] These changes in the intravascular volume may affect the rheological profile, which in turn may affect the perfusion of different organs.
Some studies reported an increase in the blood and plasma viscosity after hemodialysis[7–9] without referring to elasticity. However, viscoelasticity differentiates during an oscillating shear between the elastic (energy storing) and the viscous (energy dissipating)[9] deformation of the flowing blood. Therefore both components should be studied simultaneously which is the aim of our study.
Materials and Methods
Twenty-one patients (13 men and 8 women), aged between 46 and 82 years, with HD duration of 2–5 years participated in the study. Nine patients had type II diabetes for more than 5 years. Written consent was obtained from all patients, and the study was approved by the Institutional Review Board of Beth Israel Medical Centre. Patient demography is presented in Table 1.

All patients were receiving in center HD 4 h three times a week using bicarbonate dialysate and F80A polysulphone dialysis filters (Fresenius Medical Care, USA). The dialysate contained (in mmol/L) sodium 140, chloride 108, potassium 2, calcium 1.5, magnesium 0.5, bicarbonate 36, and acetate 3. The pump flow was between 320 and 400 mL/min. Twelve patients had AV-fistula, 10 of them radiocephalic, and two brachiocephalic fistula. Nine patients had arteriovenous graft made from polyfluoroethylene (PTFE).
For each patient UF rate was set with the ultimate goal of reaching the clinically determined dry weight. UF volume was recorded by the dialysis machine (2008H, Fresenius Medical Care, Walnut Creek, CA, USA). Relative blood volume changes (RBV) and hematocrit were measured by the blood volume monitor Fresenius (Fresenius Medical Care, Hamburg, Germany). It is based on the principle that the total protein concentration, the sum of hemoglobin and plasma proteins in the vascular space, changes during ultrafiltration. Changes of total protein concentration are determined from the velocity of sound waves in blood, measured using a cuvette in the extracorporeal circuit designed for this purpose.[10]
Blood samples were collected from the “arterial” needle port of the dialysis access. Samples for hemorheology measurements were collected in 5 mL tubes containing 0.057 mL ethylenediamintetrachloroacetic acid (EDTA), while samples for fibrinogen were withdrawn in 4.5 mL tubes containing 1.1 mL buffered Na citrate 3.2%. Predialysis samples were taken just before the start of dialysis. To withdraw blood samples at the end of dialysis, the pump flow rate was turned down to 80 mL/min for 20 s, and then samples were withdrawn.
Samples for plasma fibrinogen were centrifuged at 2000 rpm for 10 min. The supernatant was then frozen and kept at –45°C pending analysis. Analysis was done by Futura autoanalyzer (Instrumentation laboratory, Fullerton, CA, USA).
Thurston, 1979[11] designed the first oscillating capillary rheometer which was used for rheological measurements. Further development of this apparatus was carried out and resulted in the OCR-D (A. Paar, Graz, Austria) which was used in our study. The operating characteristics of the machine are summarized as follows: shear rate range 0.2–200 per s, operating frequency 2 Hz, viscosity range 0.2–50 mPa.s, temperature range +10 to +50°C, sample size 1.5 mL approximately, and test time 5 min approximately. A diagram of the machine is presented in Figure 1.

- Schematic diagram of the oscillating capillary viscometer
The determination of viscoelasticity is based upon the mechanical oscillation technique. This oscillation is sinusoidal in character, that is, it has sine waves and this simulate pulsatile flow in vivo.[12] The oscillating flow is generated by an electrodynamic oscillator, the deflection of which is applied to the sample in the capillary by a driving liquid (water). Sample and driving liquid are separated from each other by a diaphragm for a single use.
The amplitude of the flow rate is specified by varying the oscillator's amplitude in the capillary. The amplitude of the deflection is measured with a strain gauge transducer, while that of the pressure within the driving liquid is determined using a plezo pressure transducer. From these two values and the phase angle between pressure and deflection, the viscoelastic parameter can be calculated.
The hemorheological variables included whole blood viscosity, plasma viscosity, red cells elasticity, and aggregation index. They were assessed at 37°C. Blood sample (1.5 mL) was introduced with the diaphragm for single use into the measured capillary. All further operations – control, measurements, and evaluation – were carried by a desk computer thus providing for a fully automatic measurement procedure. After temperature equilibration both pick-ups are balanced. Varying the oscillator deflection causes changes in the shear rate. The amplitude of oscillations was increased in 10 discrete steps covering a range of maximum shear rates from 0.5 to 150 per s. For each step the instrument calculates the viscous and elastic components of the complex viscosity as well as shear rate. Blood and plasma viscosity and blood elasticity were calculated, at a shear rate 150 per s at the native hematocrit, by special formulas which were described elsewhere.[13]
From the measured values, a computer program calculates the rheological data – viscous and elastic components of the complex viscosity dependent on the shear rate. This evaluation is valid exactly for linear viscoelasticity, that is, for low amplitudes. High amplitudes provide information for the nonlinear viscoelastic behavior. Data can be stored on a data cartridge and recalled.
Aggregation index was calculated from the analyzed whole blood viscosity at low shear rate, that is, 0.5 s-1 standardized to Hct 45%. Under low-flow conditions, red cells in plasma form linear aggregates.[14] Low shear forces promote red cell aggregation more than does stasis presumably because they promote intercellular contact. With increasing shear rate, red cell aggregate are progressively deformed and dispersed. Full dispersion occurs at sear rate about 50 per s.[14] Therefore, aggregation index is usually calculated at low shear rate. This is done through a certain formula which was documented by Chmiel et al.[13]
The data were expressed as means±standard deviations. The two-tailed t test for paired data was used for comparisons of measurements at the beginning and the end of dialysis. A P value of <0.05 was considered significant. The association between variables has been tested by Pearson correlation.
Results
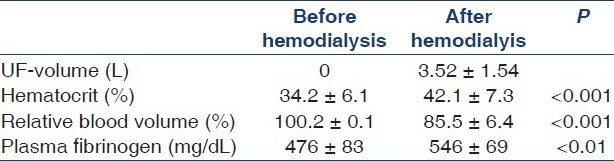
The UF volume was 3.52±1.54 L (range 1.49–6.00 L), and the UF rate ranged from 750 to 1500 mL/h. At the end of HD, relative blood volume decreased significantly from 100.2±0.1% to 85.5±6.4% (P<0.001), while Hct significantly increased from 34.2±6.1% (range 22.7–43.4%) to 42.1±7.3% (range 30.2–50.5%) (P<0.001). Plasma fibrinogen increased significantly from 476±83 to 546±69 mg/dL (P<0.01) [Table 2]. Whole blood viscosity increased significantly at the end of dialysis from 3.28±0.69 to 5.48±0.85 mPa.s (P<0.001), and plasma viscosity from 1.24±0.16 to 1.65±0.24 mPa.s (P<0.001). Red cells elasticity and aggregation index significantly increased from 0.26±0.12 to 0.48±0.18 mP.s (P<0.05) and from 0.86±0.31 to 1.25±0.26 (P< 0.01), respectively [Table 3]. The increase in plasma viscosity was significantly correlated to the increase in plasma fibrinogen (r=0.63, P<0.05) [Figure 2]. The increase in blood viscosity was significantly correlated to the percent decrease in blood volume (r=0.85, P<0.005) [Figure 3]. Although aggregation index significantly increased after dialysis, it was not significantly correlated to UF or changes in plasma fibrinogen [Table 4].


- Increased blood viscosity was significantly correlated to the percent decrease in blood volume induced by ultrafiltration (r = 0.85, P < 0.005)

- Plasma-induced changes in plasma viscosity were significantly correlated to changes in plasma fibrinogen (r = 0.63, P < 0.05)

Discussion
The blood flow is determined by Poiseuille formula:[15]

where Q is the flow, ΔP is pressure gradient, π = 3.1412, L is the length of vessel segment, η is the viscosity of blood, and r4 is the radius raised to the fourth power.
This formula shows that the flow is inversely related to viscosity, and the importance of the viscosity factor becomes more significant when the vessels are atherosclerotic and unable to dilate. Hyperlipidemia and atherosclerosis are common in HD patients;[16] therefore viscosity disorders in these patients may have detrimental problem on blood flow.
Blood viscosity is determined by the following parameters: plasma fibrinogen, Hct, and red cell characteristics that are determinants of red cell aggregation. The hemorheological behavior of the blood will therefore depend on the composition and amount of red cells and plasma proteins in addition to the shear rate.[17]
In the present study, Hct increased significantly at the end HD, which causes the significant increase in whole blood viscosity. Moreover, the predialysis plasma viscosity was high, and increased significantly at the end of HD. The increase in plasma fibrinogen may account for changes in plasma viscosity as explained by the significant correlation between the changes in plasma viscosity and fibrinogen. Fibrinogen has the highest intrinsic viscosity due to its asymmetry (ratio of length to diameter is 18.4), and its intrinsic viscosity exceeds that of IgM despite the fact the molecular weight of IgM is three times higher.[18] The increase in plasma viscosity was significantly positively correlated to the increased plasma fibrinogen induced hemoconcentration as a result of ultrafiltration.
Red cell aggregation can be defined as the reversible adhesion of red cells into three-dimensional rouleaux induced by bridging of various immunoglobulin and fibrinogen between adjacent red cell membranes. It was found that high plasma fibrinogen inhibits the electric repulsion between different red cells.[19] In the present study, aggregation index was within normal before HD, and significantly increased at the end of HD. The increase is not significantly correlated to the increase in plasma fibrinogen.
Viscoelasticity means that blood flow are partly energy-dissipative during flow (viscosity), and partly energy-storing during dispersion.[13] Therefore, elasticity is another coexistent parameter which should be addressed with viscosity. This has not been done in previous studies.
The present study shows that blood elasticity was higher than the reference value at shear rate 150 per s and increased significantly after HD. As blood is a viscoelastic fluid, it has two mechanisms which store the mechanical energy during flow and releases part of it when the driving force of the flow is decreased: (1) the cell aggregation process, since the dispersed state must be a higher energy state than the aggregated state[20] and (2) the cell deformation process, since the red cell membrane is known to have elastic properties. The increase in blood elasticity at the end of HD may be attributed to increased aggregation index and also cell-to-cell interaction increased due to the hemoconcentration.[21] Increased blood elasticity means that red cells require more cardiac energy to disaggregate and orientate. Failure to supply this energy may result in impaired perfusion of tissues.[4]
In summary, the outcome of the present study shows that blood viscosity increased after HD, which may affect flow in large vessels. Also, there was an increase in plasma viscosity which may affect the blood flow in the microscopic vessels which are the major site for viscous energy dissipation where viscosity strongly hinders fluid motion.[22] In these vessels, the viscosity of the blood is significantly different from that found in the macrovessels.[2324] It is much lower in high flow, but higher in low flow than in the macroscopic vessels. Thus, if a patient presents with an elevated concentration of plasma fibrinogen (and thence elevated plasma viscosity as well as higher tendency to red cell aggregation), and in combination with a high Hct level, the blood in the capillaries may be only slightly less fluid at high flow, but it carries the risk of losing its fluidity behind a stenosis.[25] Furthermore, the increased elasticity requires more myocardial energy to disaggregate the red cells and this may induce problems in the patients with systolic dysfunction or cardiac decompensation. Rostand et al.[26] found that the occurrence of symptomatic ischemic heart disease far exceeded the presence of atherosclerotic coronary artery narrowing in HD patients. This indicates that hindrance of flow may occur without significant obstructive lesions.
In conclusion, HD induces changes in hemorheological profile, which may possibly carry the risk of compromising tissue perfusion specially in patients with stenotic lesion or cardiac decompensation.
The authors wish to thank Marlene Jegeborn for her generous help by supplying the necessary information about the Viscometer OCR-D.
Source of Support: Nil
Conflict of Interest: None declared.
References
- Physiology and biophysics of the circulation. Chicago: Year Book Medical Publishers Inc; 1965. p. :53-60.
- [Google Scholar]
- Method for the calculation of velocity, rate of flow and viscous drag in arteries when the pressure gradient is known. Am J Physiol. 1955;127:553-63.
- [Google Scholar]
- Rheological parameters for the viscosity, viscoelasticity and thixotropy of blood. Biorheology. 1979;16:149-62.
- [Google Scholar]
- Effect of hemodialysis on whole blood viscosity. Int J Artif Organs. 2009;32:29-335.
- [Google Scholar]
- Haemorheological alterations in patients with chronic renal failure. Effect of hemodialysis. Clin Haemorheol Microcirc. 1999;21:1-6.
- [Google Scholar]
- Increased albumin and fibrinogen synthesis in hemodialysis patient with normal nutritional status. J Am Soc Nephrol. 2001;12:49-354.
- [Google Scholar]
- Evaluation of an ultrasonic blood volume monitor. Nephrol dial transplant. 1998;13:2098-103.
- [Google Scholar]
- Rheological parameters for the viscosity, viscoelasticity and thixotropy of blood Biorheol. . 1979;16:149-62.
- [Google Scholar]
- The determination of blood viscoelasticity in clinical hemorheology. Biorheol. 1990;27:883-94.
- [Google Scholar]
- On the shear rate dependence of red cell aggregation in vitro. J Clin Invest. 1968;47:1447-54.
- [Google Scholar]
- Overview of the circulation, medical physics of pressure, flow and resistance. Text Book of Medical Physiology 1996:161-9.
- [Google Scholar]
- Factors involved in vascular calcification and atherosclerosis in maintenance haemodialysis patients. Nephrol Dial Transplant. 2007;22:515-21.
- [Google Scholar]
- Therapeutic approaches to abnormalities of blood rheology in vascular diseases. In: Das PC, ed. Supportive therapy in haematology. Boston Dordrecht: Martinus Nijhoff Publishers; 1985.
- [Google Scholar]
- Increased erythrocyte adhesiveness and aggregation in peripheral venous blood of women with pregnancy-induced hypertension. Obst Gynecol. 2001;98:307-12.
- [Google Scholar]
- Dielectric approach to investigation of erythrocyte aggregation. II. Kinetics of erythrocyte aggregation-disaggregation in quiescent and flowing blood. Biorheology. 2000;37:429-41.
- [Google Scholar]
- Microrheology of erythrocytes and thrombocytes. Blood viscosity and the distribution of blood flow in the microcirculation. In: In: MeessenHandbuch der allgemeinen Pathologie. Vol 3/7. Mikrozirkulation Heidelberg: Springer; 1977. p. :289-384.
- [Google Scholar]
- Macrorheology and microrheology of blood in cerebrovascular insufficiency. Eur Neurol. 1983;22:2-22.
- [Google Scholar]
- Heart and circulation. In: Greger R, Windhorst U, eds. Comprehensive Human Physiology. Vol 2. Heidelberg: Springer-Verlag Berlin; 1996. p. :1748-91.
- [Google Scholar]
- Blood fluidity as a consequence of red cell fluidity.Flow properties of blood and flow behaviour of blood in vascular diseases. Angiology. 1980;31:301-19.
- [Google Scholar]
- Dialysis-associated ischaemic heart disease: Insights from coronary angiography. Kidney Int. 1984;25:653-9.
- [Google Scholar]