

Translate this page into:
The Kt/V by ionic dialysance: Interpretation limits
This is an open-access article distributed under the terms of the Creative Commons Attribution-Noncommercial-Share Alike 3.0 Unported, which permits unrestricted use, distribution, and reproduction in any medium, provided the original work is properly cited.
This article was originally published by Medknow Publications & Media Pvt Ltd and was migrated to Scientific Scholar after the change of Publisher.
Abstract
The availability of hemodialysis machines equipped with online clearance monitoring (OCM) allows frequent assessment of dialysis efficiency and adequacy without the need for blood samples. Accurate estimation of the urea distribution volume (V) is required for Kt/V calculated from OCM to be consistent with conventional blood sample-based methods. A total of 35 patients were studied. Ionic dialysance was measured by conductivity monitoring. The second-generation Daugirdas formula was used to calculate the Kt/V single-pool (Kt/VD). Values of V to allow comparison between OCM and blood-based Kt/V were determined using Watson formula (VWa), bioimpedance spectroscopy (Vimp), and blood-based kinetic data (Vukm). Comparison of Kt/Vw ocm calculated by the ionic dialysance and Vw (Kt/Vw ocm) with Kt/VD shows that using VW leads to significant systematic underestimation of dialysis dose by 24%. Better agreement between Kt/V ocm and Kt/VD was observed when using Vimp and Vukm. Bio-impedancemetry and the indirect method using the second-generation Daugirdas equation are two methods of clinical interest for estimating V to ensure greater agreement between OCM and blood-based Kt/V.
Keywords
Bioimpedance
ionic dialysance
Kt/V
urea distribution volume
urea kinetic
modeling
Watson formula

Introduction
The delivered dose of dialysis is an important predictor of patient outcome.[12] The most useful and widely applied index to prescribe the dialysis dose (as well as to assess the dose that is actually delivered) is the Kt/V formula. In order to assess Kt/V, the second-generation Daugirdas formula is advocated by guidelines.[34]
Recent studies suggest a substantial variation in delivery of Kt/V within intraindividual hemodialysis (HD) treatments on a session-to-session basis.[5] Thus, a more frequent assessment of Kt/V is desirable. However, the need for blood sampling makes more frequent assessment of Kt/V, by the standard approach, impractical. Therefore, measurement of delivered dialysis dose on each dialysis would be desirable if it could be achieved without blood samples.
Recent advances in the online monitoring of conductivity during HD sessions have made the repeated measurement of Kt/V on all HD treatment sessions a practical proposition. This method relies on the fact that the diffusive properties of sodium and urea are similar and that sodium flux can be measured noninvasively using conductivity measurements in the dialysate.[6] Devices using the ionic dialysance method measure both clearance (K) and treatment time (t) but require a precise input value for the urea distribution V for calculating Kt/V.[78]
The aim of this study was to assess the agreement between Kt/V measured by ionic dialysance (Kt/V ocm) and Kt/V calculated with Daugirdas formula (Kt/VD), taking into account different estimates of V.
Materials and Methods
We prospectively studied 35 chronic HD patients. All patients were stable clinically and hemodynamically and have been on HD for more than 10 months. Residual renal urea clearance was neglected in all patients. All patients were dialyzing via arteriovenous fistula (AVF).
The study treatments were performed using a Fresenius 5008 machine (Fresenius Medical Care, Hamburg, Allemagne) equipped with an online clearance monitor (OCM) and a blood temperature monitor (BTM). All patients were dialyzed with high-permeability polyamide dialyzers (surface between 1.7 and 2 m2).
No profile of dialysate sodium has been used and the temperature of dialysate was set at 37°C.
Effective ionic dialysance (Kocm) was measured by conductivity monitoring using the OCM. A conductivity change was initiated automatically every 25 min. Mean ionic dialysance multiplied by the real duration of the session was used to calculate Kt ocm.
To simplify measurements, taking any food or water was prohibited during the course of the dialysis session. Patients’ weight was measured before and after the session to determine weight loss (P).
Total body water, which is assumed to be equal to urea distribution V, was calculated by the dialysis machine by using the empirical formula of Watson (Vw); this calculation was carried out taking into account post-dialysis weight, height, gender, and age [Appendix A]. Vw was used to calculate Kt/Vocm (KT/Vw.ocm).
Kt/Vw.ocm was studied as a function of Kt/V.D calculated from urea kinetic modeling (UKM) based on the pre- and post-dialysis serum urea:
-
In single-pool (KT/V.Dsp): By Daugirdas second generation equation calculated from pre- and post-dialysis urea in a single treatment, time of the session, and ultrafiltration V [Appendix B].
-
In double-pool (KT/V.Deq): Assessed after the correction of (Kt/V.Dsp) using the rate adjustment equation of Daugirdas and Schneditz [Appendix C].
We also compared the urea distribution V calculated by Watson formula (Vw) with that:
-
Measured directly by bioelectrical impedance spectroscopy: Bioimpedance measurements were performed using the Body Composition Monitor (Fresenius Medical Care) before HD session. Overhydration was subtracted from the measured total body water to yield total body water at dry weight (Vimp).
-
Calculated indirectly from urea distribution V: Kt/Kt/V.Dsp:
-
Vukm: Using the clearance measured by ionic dialysance (Kocm) - Vukm = (Kocm.t) / (Kt/V.Dsp)
-
Vkoa: Using theoretical dialyzer clearance (Kkoa), which takes no account of the recirculation [Appendix D] -Vkoa= (Kkoa.t) / (Kt/V.Dsp).
The stability of total water V measured by UKM (Vukm) was studied on three successive months (M0, M1, and M2).
Kt/V.ocm was recalculated using Vimp to assess agreement with Kt/V.D.
Agreement between data was analyzed using linear regression and Bland–Altman analysis. Comparative study was conducted using student's t-test and repeated-measures analysis of variance (ANOVA).
Results
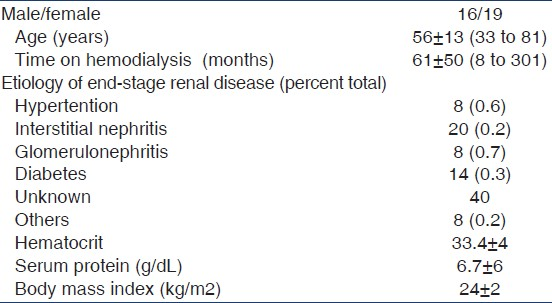
Table 1 shows the demographic data of 35 patients. Table 2 presents the dialytic data of 35 HD sessions.

KT/Vwocm versus KT/VDsp et KT/VDeq
A significant correlation was observed between Kt/V measured by ionic dialysance and using Watson formula to determine urea V distribution (Kt/Vw.ocm) and Kt/V calculated by Daugirdas formula (Kt/V.D) in both single and double pool [Figures 1 and 2].

- Correlation between KT/Vw ocm and KT/VDsp (r=0.71, P<0.001)
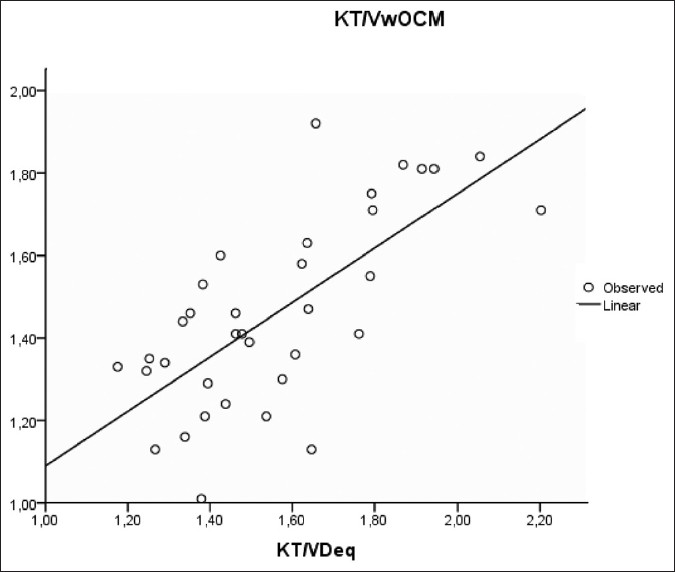
- Correlation between KT/Vw ocm et KT/VDeq (r=0.7, P<0.001)
However, Kt/Vw.ocm led to systematic underestimation of Kt/V.Dsp by –0.33 ± 0.19 (P < 0.001) and the Kt/VD.eq by –0.10 ± 0.18 (P < 0.001) [Figures 3 and 4 and Table 3].
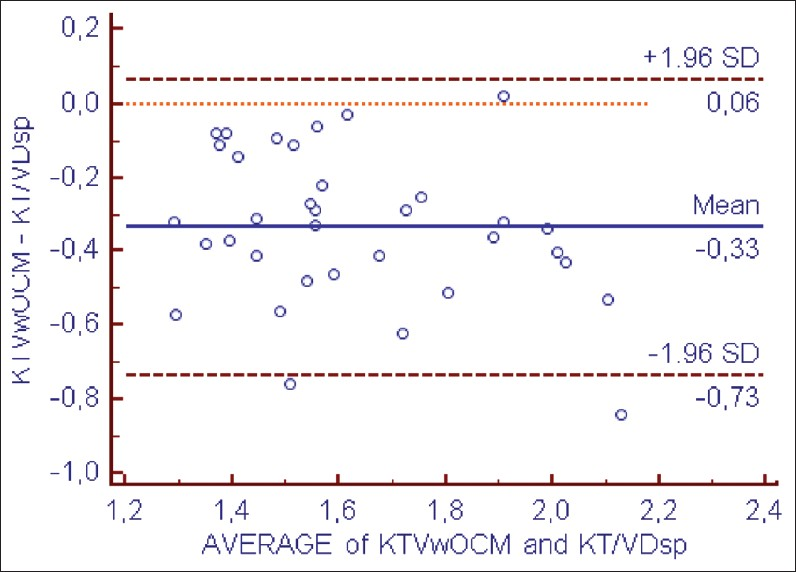
- Bland–Altman analysis of agreement between KT/Vw ocm and KT/VDsp

- Bland–Altman analysis of agreement between KT/Vw ocm et KT/VDeq

Calculated Kt/V.Deq >1.2 was achieved in all our patients, while online Kt/Vw.ocm >1.2 was achieved in only 88% of the patients.
There was negative correlation between mean dialysance and recirculation rate measured by thermodilution (r = – 0.6, P < 0.001), as shown in Figure 5.

- Correlation between recirculation rate and ionic dialysance (r=- 0.6, P<0,001)
Watson versus Vimp, Vukm et Vkoa
There was also a significant correlation between Vw (34 ± 5 L) and successively Vimp (27 ± 4 L), Vkoa (32 ± 5 L), and Vukm (32 ± 5 L) [Figures 6–8]. However, a significant difference was observed between these different methods of V estimation.
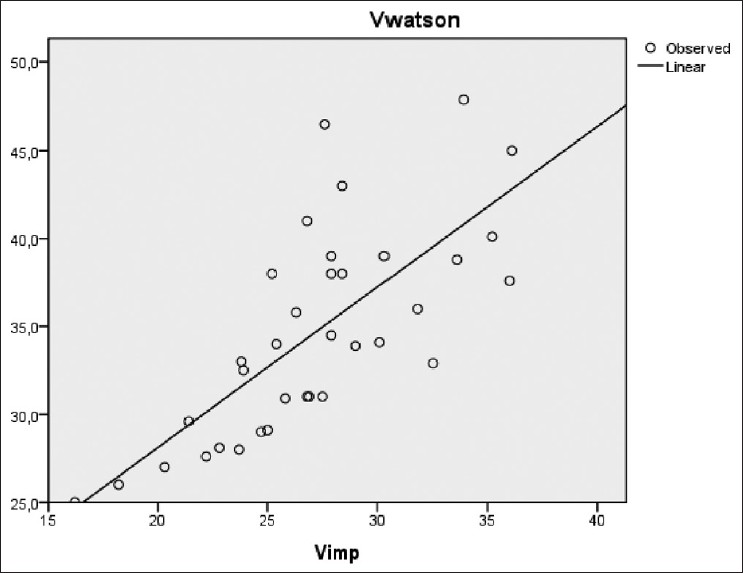
- Correlation between VWatson versus Vimp (r=0.73, P<0.001)
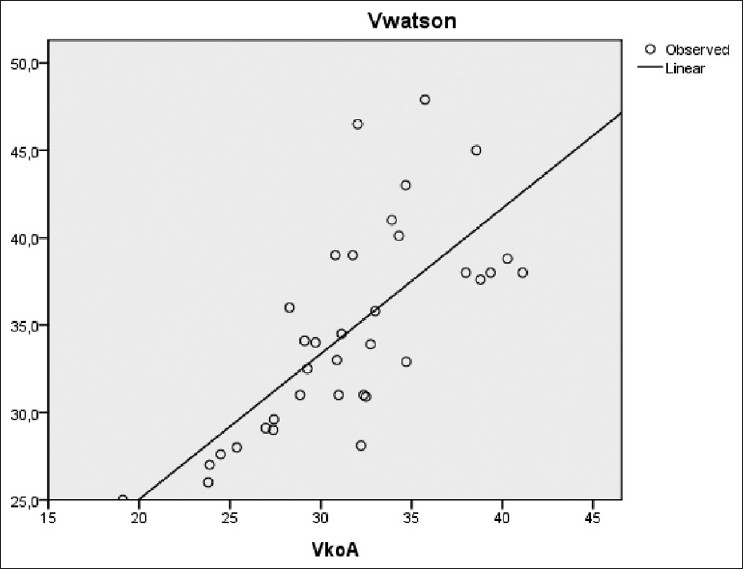
- VWatson versus Vkoa (r=0.73, P<0.001)

- VWatson versus Vukm (r=0.7, P<0.001)
Agreement between Vw and Vimp (mean difference =7.5 L, SD =4 L) [Figure 9] suggests that the Watson formula systematically overestimates total body water in dialysis patients.

- Bland–Altman analysis of agreement between Watson volume and bioimpedance
Vimp agreed well with Vukm, and there was a good agreement between the two methods (mean = –1 with a SD =3 L) [Figure 10].

- Bland–Altman analysis of agreement between kinetic volume (Vukm) obtained using effective clearance (KTocm) as input to urea kinetic modeling and bioimpedance volume (Vimp)
Kinetic distribution V (Vkoa) agreed less with Vimp when theoretical dialyzer clearance was used as an input to UKM (mean =5 L, SD =4 L). Vkoa was closer to Vw.
Urea distribution V was found to be reproducible over the observation period of 3 months (28 ± 4 L at M0, 27 ± 6 L at M1, 28 ± 5 L at M2; P = 0.75).
KT/VDsp versus (KT/Vimp Ocm) et (KT/Vukm Ocm)
Both when using Vukm and Vimp as estimates of V, the agreement between Kt/V.ocm (1.9 ± 0.22) and Kt/V.Dsp (1.8 ± 0.28) became stronger. The perfect agreement with the Kt/V.Dsp when kinetically determined V (Vukm) is used as V component is because both results are not independent of each other.
Discussion
The data analysis has proven the high correlation of urea and electrolytic dialysance similar to that already demonstrated by other authors,[5–813] but showed significant differences between both methods when anthropometric formulas were used to estimate V. This finding was objectified by some previous publications.[7814]
The concept of ionic dialysance is based on substitution of ionic concentration measurements by conductivity measurements. OCMs measure the difference in conductivity between the dialysate entering and leaving the dialyzer with two different dialysate inlet electrolyte concentrations.[15] These measurements can be used to calculate the ionic dialysance.[611]
The use of OCM is based on the finding that ionic dialysance and urea clearance are equivalent. This has been demonstrated in a number of studies that have investigated the influence of recirculation and blood water and shown that Kocm is comparable with blood water urea clearance, taking into account recirculation,[1617] which was found in our study. The OCM thus provides an effective urea clearance.[18]
The difference of 2-5% for momentary measurements that is reported in several studies in the past has mainly been attributed to differences in the diffusion coefficients of urea and sodium, and to different membrane effects or inadequate correction of ultrafiltration. The effect of sodium load or unload on the whole body water when performing the conductivity variations has erroneously been neglected. Furthermore, it was demonstrated that different types of conductivity variations – each with specific sodium loads – differ in their results under the same conditions.[19] Gotch et al. have postulated that ionic dialysance may underestimate effective urea clearance due to the effects of systemic salt loading during ionic dialysance measurements, resulting in a reduced conductivity diffusion gradient across the dialyzer, especially when urea clearance is >150 ml/min.[16]
The Kt/V also depends on the effective duration of dialysis (t). This time is constant when considering the cases related to alarms and bypass. Therefore, the duration of dialysis could not explain the underestimation of the Kt/V by OCM.
This study confirmed that anthropometrically estimated volumes are significantly larger than the urea distribution V determined from UKM or bioimpedance. This has been demonstrated by others.[520–23]
A possible explanation for our observation that V calculated from anthropometric data may overestimate total body water is that a significant depletion in muscle mass is present in many dialysis patients and that the urea generation rate seems not to be included correctly in Watson's formula.[519] Anthropometric equations derived from healthy individuals would lead to an overestimation of V in this case.
Because of this overestimation of V, McIntyre et al., who studied a more homogeneous group of patients, showed a better agreement between Kt/Vw.ocm and Kt/V.Deq, in contrast to the data of Filippo et al. who showed higher values for Kt/V measured by ionic dialysance compared with Kt/V.Deq.[1524] In our study, we found that ionic dialysance with Vw underestimates by 7% Kt/V.Deq. It is possible that differences between study populations and nature of conductivity methods may explain this reported difference.[7]
UKM can be used to determine urea distribution volume provided a correct value of clearance is used as input and adjustment for errors in single-pool modeling is applied (Kt/V.Dsp).[1325] Actual clearance can be substantially lower than theoretic clearance in case of recirculation, clotted fibers, or blood flow rate reduction. Compared to our study, Wuepper et al. showed Vkoa to be significantly higher than Vimp. The agreement reported in the literature between Vw and V calculated indirectly from UKM can be explained by the use of theoretic clearance (Vkoa) and not effective urea clearance.[26] Measuring recirculation and using a corrected clearance as input to UKM account for the major part of the clearance reduction and lead to a Vukm that is much closer to Vimp. This agreement between Vukm and Vimp was found in our study. Other studies report similar results.[5813] A recent study undertaken by Koubaa et al. has concluded that V determined by UKM offers good agreement with the method based on direct dialysis quantification by collection of spent dialysate. However, the reproducibility of Vukm may be affected by errors in blood sampling, the urea generation rate, residual renal urea clearance, and variation in laboratory results.[8]
Bioimpedance has been found to agree closely with body water calculated from deuterium oxide dilution and by direct quantification of dialysis studies in patients with HD.[1320] However, the results differ according to the technique (mono- or multi-frequency impedance) and to the mathematical model used.[13] The reproducibility of Vimp depends on electrode positioning and contact, and various patient-related factors that are relatively easy to control.[13]
Our study indicated that bioimpedance V offers a good agreement between ionic dialysance and the Kt/V.Dsp. This agreement would be theoretically perfect with Vukm. In our study, no significant variation was noted in Vukm over a 3-month period. Wuepper et al. and Moret et al. suggest that a variability in Vukm during a 1-month period would appear acceptable for clinical purposes.[57]
Conclusion
While there is a good correlation between the two methods, ionic dialysance with the use of Watson's formula underestimates the Kt/V assessed by UKM. This could be explained by the observed difference between the real urea distribution V and that calculated using this anthropometric formula. Thus, frequent assessment of V by bioimpedance or UKM (Kt.ocm/Kt/V.D) could ensure greater agreement. This should be done with great care because V reduction increases Kt/V and bears the risk of under-dialysis if it is used for dose prescription. A careful clinician will frequently control the prescription using laboratory values.
Source of Support: Nil
Conflict of Interest: None declared.
References
- A mechanistic analysis of the national cooperative dialysis study. Kidney Int. 1985;28:526-34.
- [Google Scholar]
- I. NKF-K/DOQI Clinical practice guidelines for hemodialysis adequacy: Update 2000. Am J Kidney Dis. 2001;37:S7-S64.
- [Google Scholar]
- European Best Practice Guidelines Expert Group on Hemodialysis, European Renal Association. Section II haemodialysis adequacy. Nephrol Dial Transplant. 2002;17:16-31.
- [Google Scholar]
- Determination of urea distribution volume for Kt/V assessed by conductivity monitoring. Kidney Int. 2003;64:2262-71.
- [Google Scholar]
- Festschrift for Professor Claude Jacobs.Recent developments in conductivity monitoring haemodialysis session. Nephrol Dial Transplant. 1999;14:2607-13.
- [Google Scholar]
- Ionic dialysance and the assessment of Kt/V: The influence of different estimates of V on method agreement. Nephrol Dial Transplant. 2007;22:2276-82.
- [Google Scholar]
- A comparison of methods for determining urea distribution volume for routine use in online monitoring of haemodialysis adequacy. Nephrol Dial Transplant. 2009;24:211-6.
- [Google Scholar]
- Total body water volumes for adult males and females estimated from simple anthropometric measurements. Am J Clin Nutr. 1980;33:27-39.
- [Google Scholar]
- Second generation logarithmic estimates of singlepool variable volume Kt/V: An analysis of error. J Am Soc Nephrol. 1993;4:1205-13.
- [Google Scholar]
- Overestimation of hemodialysis dose depends on dialysis efficiency by regional blood flow but not by conventional two pool urea kinetic analysis. ASAIO J. 1995;41:M719-24.
- [Google Scholar]
- Models to predict recirculation and its effect on treatment time in singleneedle dialysis, in first international symposium on singleneedle dialysis. Cleveland: ISAO Press; 1984. p. :305.
- [Google Scholar]
- Estimation of urea distribution volume in hemodialysis patients. Néphrol Thér. 2010;6:532-6.
- [Google Scholar]
- Online conductivity monitoring of dialysis adequacy versus Kt/V derived from urea reduction ratio: A prospective study from a Saudi center. Int J Nephrol Renovasc Dis. 2009;2:27-31.
- [Google Scholar]
- How to determine ionic dialysance for the online assessment of delivered dialysis dose? Kidney Int. 2001;59:774-82.
- [Google Scholar]
- Mechanisms determining the ratio of conductivity clearance to urea clearance. Kidney Int Suppl. 2004;89:S3-24.
- [Google Scholar]
- Accuracy and safety of online clearance monitoring based on conductivity variation. Nephrol Dial Transplant. 2001;16:1053-8.
- [Google Scholar]
- Ionic dialysance measurement is urea distribution volume dependent: A new approach to better results. Artif Organs. 2002;26:321-32.
- [Google Scholar]
- Comparing different methods of assessing body composition in endstage renal failure. Kidney Int. 2000;58:408-16.
- [Google Scholar]
- Nutritional assessment with bioelectrical impedance analysis in maintenance hemodialysis patients. J Am Soc Nephrol. 1995;6:75-81.
- [Google Scholar]
- Anthropometrybased equations overestimate the urea distribution volume in hemodialysis patients. Kidney Int. 2001;59:1165-74.
- [Google Scholar]
- Best method for estimating urea volume of distribution: Comparison of single pool variable volume kinetic modeling measurements with bioimpedance and anthropometric methods. ASAIO J. 2004;50:237-41.
- [Google Scholar]
- Assessment of haemodialysis adequacy by ionic dialysance: Intra–patient variability of delivered treatment. Nephrol Dial Transplant. 2003;18:559-63.
- [Google Scholar]
- Urea distribution volume calculated by ionic dialysance. Nefrologia. 2006;26:121-7.
- [Google Scholar]
- Total body water measured by bioelectrical impedance in patients after hemodialysis.Comparison with urea kinetics. ASAIO J. 1992;38:186-9.
- [Google Scholar]
Appendices
Appendix A: Watson equation for males:[9]
Male: VWatson = +2.447 + 0.3362 × weight (kg) +0.1074 × height (cm) - 0.09156 × age (years)
Female: VWatson = – 2.097 + 0.2466 × weight (kg) +0.1069 × height (cm)
Appendix B: The Daugirdas second-generation equation:[10]

ΔP: Weight loss by ultrafiltration - P: Post-dialysis weight - t: Duration of the session.
Cend et C0: The urea concentrations at the start and end of the interdialytic interval.
To avoid dilution to obtain the post-dialysis sample (ct), the ultrafiltration rate was set to zero and blood pump rate was reduced to 100 ml/min. Ten seconds after reducing the blood flow, the blood pump was turned off. The sample was then drawn from the arterial needle tubing.
Plasma urea concentrations were corrected for plasma water according to this equation:
C (g/Kg water) = C (g/l) (1 - 0,001*Protidemia (g/l))
Appendix C: Equation of Daugirdas and Schneditz (The rate equation to convert single-pool Kt/V into equilibrated Kt/V):[11]
(Kt/V)eq = (Kt/V)Dsp – (0.6/t) (Kt/V)Dsp +0.03
Appendix D: Theoretical dialyzer clearance (Kkoa):[512]

Where: Blood water flow Qbw = Qb.(0.940.22, hematocrit)
Koa: Dialyzer efficiency
Qd = Dialysate flow, Qf: Ultrafiltration rate