

Translate this page into:
Role of Blood Oxygen Level-dependent MRI in Differentiation of Acute Renal Allograft Dysfunction
This is an open access journal, and articles are distributed under the terms of the Creative Commons Attribution-NonCommercial-ShareAlike 4.0 License, which allows others to remix, tweak, and build upon the work non-commercially, as long as appropriate credit is given and the new creations are licensed under the identical terms.
This article was originally published by Medknow Publications & Media Pvt Ltd and was migrated to Scientific Scholar after the change of Publisher.
Abstract
Early graft dysfunction after renal transplantation manifests as acute rejection (AR) or acute tubular necrosis (ATN). Blood oxygen level-dependent (BOLD) magnetic resonance (MR) imaging is a noninvasive method of assessing tissue oxygenation, which may be useful for predicting acute allograft dysfunction. This was a prospective study involving 40 patients scheduled for renal transplantation from August 2012 to August 2014. In addition, 15 healthy donors were also enrolled in this study. All recipients underwent BOLD MR imaging (MRI) and R2* mapping 10–20 days after transplant, and additionally within 48 h of biopsy if there was any evidence of graft dysfunction. The healthy donors underwent BOLD MRI 1–2 days before surgery. The biopsies were grouped into AR, ATN, and no evidence of AR or ATN. The mean medullary R2*, cortical R2*, corticomedullary gradient, and medullary: cortical R2* ratio were compared between groups using one-way analysis of variance. Spearman's correlation and multinomial linear regression were applied to determine the influence factors of R2* value. Overall, nine patients had graft dysfunction. Six were reported as AR, two as ATN, and one as no evidence of ATN or rejection. The mean medullary and cortical R2* were significantly higher in ATN group compared with AR and normal group, whereas the mean medullary and cortical R2* of AR group were significantly lower than normal group. The corticomedullary gradient of AR group was significantly lower compared with ATN and normal group. Medullary R2*:cortical R2* ratio was significantly lower in AR group compared with normal group. No significant difference was noted between the 15 donors and patients with normal graft function. R2* values on BOLD MRI are significantly decreased in AR allografts and increased in an early stage of ATN allografts, suggesting that BOLD MRI can become a valuable tool for discriminating between AR and ATN.
Keywords
Acute rejection
acute tubular necrosis
Blood oxygen level-dependent MRI
graft dysfunction

Introduction
In patients with end-stage renal disease, renal transplantation remains the optimal means of renal replacement therapy and also prolongs survival and improves quality of life in these patients. Although advances in both surgical technique and immunosuppressive therapy have resulted in 1-year survival rates of greater than 90%, graft dysfunction in the early post-transplant period remains a significant clinical problem.[1] Early graft dysfunction due to acute rejection (AR) and acute tubular necrosis (ATN) occurs in approximately 30% of patients.[2] Early characterization of the underlying cause of acute graft dysfunction is important because delayed treatment can lead to irreversible loss of nephrons and hasten graft loss over time.[3] Allograft biopsy is relatively invasive, painful, and can potentially result in complications such as bleeding and infection. Blood oxygen level-dependent (BOLD) magnetic resonance imaging (MRI) has been used as a noninvasive method of assessing tissue oxygenation.[45678] As deoxyhemoglobin concentration in blood increases, T2* relaxation time of protons decreases and more dephasing occurs in the surrounding tissues. This produces measurable signal loss in area of increased deoxyhemoglobin concentration. In the kidney, this loss of signal intensity can be well demonstrated on a series of T2*-weighted images in which each image is acquired with a different echo time. The higher the concentration of deoxyhemoglobin, the greater the rate of signal loss and larger the R2*. These parameters have been introduced and applied to the measurement of oxygenation in the cortex and medulla of native kidneys.[45678]
BOLD MRI has been used in native kidneys to reveal differences in medullary oxygenation during renal artery occlusion, water diuresis, and pharmacological stimulation with furosemide, acetazolamide, and nitric oxide.[45678910] We applied this novel technique for evaluation of acute graft dysfunction in renal transplant recipients to see its applicability as a noninvasive tool for predicting acute renal allograft dysfunction.
Materials and Methods
A prospective study was conducted at a tertiary care hospital in northern India after approval from the institutional ethics committee. A group of 40 renal allograft recipients were enrolled for this study from August 2012 to August 2014. In addition, 15 healthy donors were also enrolled in this study. In all the recipients, BOLD MRI and R2* mapping was done 10–20 days after transplant. Those who developed acute graft dysfunction (as evident by failure of serum creatinine to normalize after transplantation or rise in serum creatinine >0.3 mg/dL after normalization)[11] underwent additional BOLD MRI within 48 h of graft percutaneous biopsy. Healthy donors underwent BOLD MRI 1–2 days before surgery.
All cases were live-related ABO-compatible transplants except for one cadaveric donor and one case of live-related ABO-incompatible donor. All recipients received triple therapy based on a combination of calcineurin inhibitors, mycophenolate mofetil, and prednisone. All patients refrained from water ingestion or intravenous transfusion 4 h before MRI and had no diuretic agents, angiotensin converting enzyme inhibitors (ACEIs), or angiotensin receptor blockers (ARBs) 12 h before MRI. There was no oxygen inhalation during BOLD MRI.
MRI technique
BOLD MRI was performed using a GE Signa 3.0 Tesla unit (GE Healthcare, Wisconsin, USA), using end expiratory breath hold 2D MPGR R2* sequence with a phased assay torso coil and 16 gradient echoes with TE from 2.1 to 32.8 ms, TR 85 ms, flip angle 40°, bandwidth 62.5, matri × 224 × 224, field of view 24–32 cm, slice thickness 5 mm, and gap 1 mm. Four sections were obtained in coronal plane of the transplanted kidney. R2* values and maps were generated using FuncTool (GE Healthcare). After image processing, regions of interest were placed in the upper, middle, and lower pole cortex and medulla using the base anatomical image guidance and R2* values were recorded [Figure 1]. These values were used to calculate the mean medullary and mean cortical R2* values. In cases of bulk susceptibility artifacts due to adjacent bowel loops or surgical wound, the regions of artifact were avoided [Figure 2]. Incidental lesions in the allograft were also avoided [Figure 3]. In 15 cases in which donor kidney evaluation was done with BOLD MRI, the same technique of R2* recording was used [Figure 4].
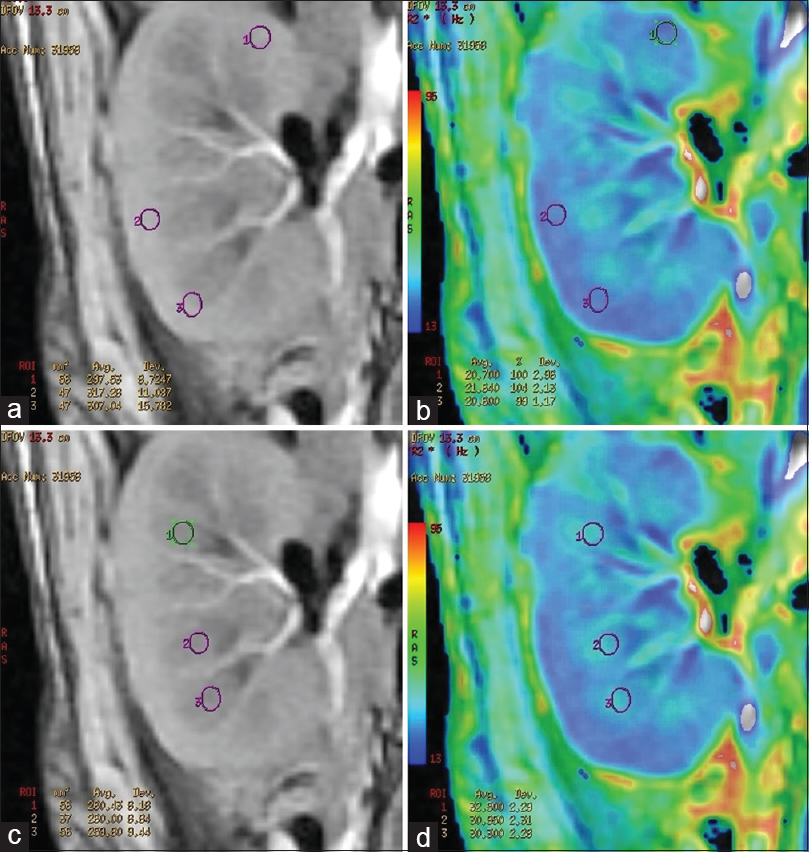
- (a) Region of interest placement in the cortex of a normal functioning allograft in the anatomical image. (b) Corresponding R2* star map and cortical R2* values. (c) Region of interest placement in the medulla of a normal functioning allograft in the anatomical image. (d) Corresponding R2* star map and medullary R2* values

- (a) R2* map showing artifactually raised R2* value in the upper pole (black arrow) of a normal functioning allograft. (b) Anatomical image of the same patient demonstrating bowel loops near the upper pole of the kidney (white open arrow) causing artifact in the R2* map
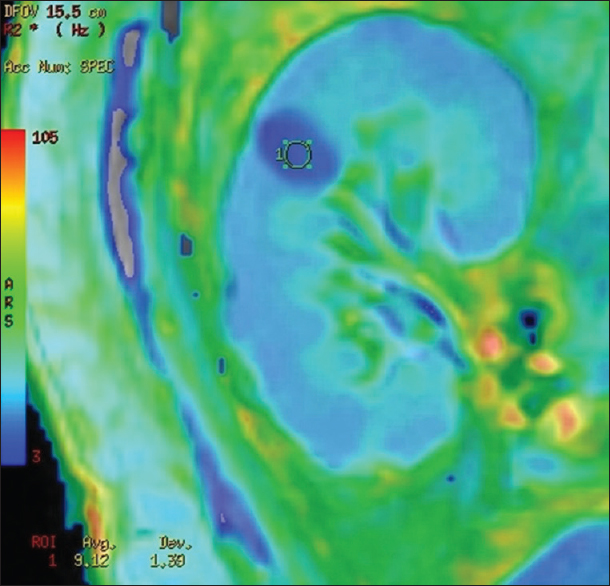
- R2* map showing a simple renal cyst showing lower color intensity and lower R2* value when compared with normal parenchyma
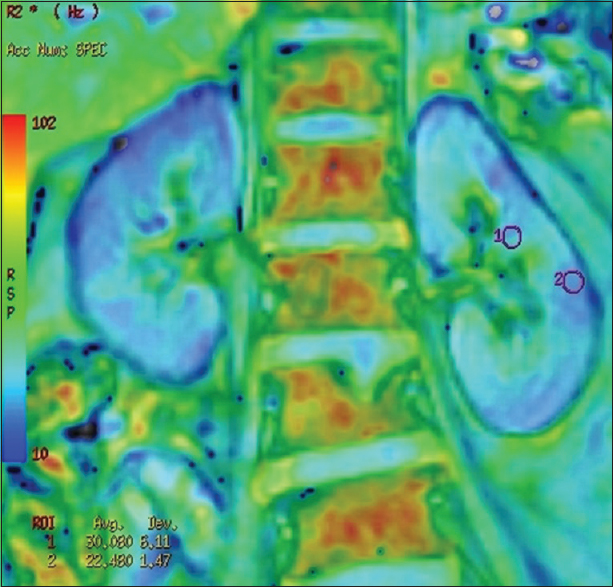
- R2* map of a donor showing regions of interest placed in mid pole medulla and cortex and corresponding R2*values
Biopsy and histopathological examination
The biopsies were performed under ultrasound guidance and were evaluated by an experienced nephropathologist. They were grouped into AR, ATN, and no evidence of AR or ATN. AR group included both antibody-mediated rejection (AMR) and T-cell-mediated rejection (TMR) based on Banff’05 criteria.[12] The AMR criteria were defined as positive peritubular capillary C4d staining by immunohistochemistry concomitant with polymorphonuclear leukocyte infiltration in peritubular capillary and vasculitis or glomerulitis. ATN was diagnosed pathologically by diffuse or multifocal renal tubular epithelium vacuolar degeneration or necrosis.
Data analysis
Numerical results were expressed as mean ± standard deviation, and the mean medullary R2*, cortical R2*, corticomedullary gradient and medullary: cortical R2* ratio were compared between groups using one-way analysis of variance (ANOVA) with post hoc test to perform pair-wise multiple comparisons. The pre- and post-transplant R2* values of the renal moiety were compared using paired t-test. Spearman's correlation and multinomial linear regression were applied to determine the influence factors of R2* value. These analyses were performed by SPSS 13.0 software (SPSS Inc., Chicago, IL, USA).
Results
Of the 40 transplant recipients, 9 patients showed graft dysfunction and underwent biopsies. Of the nine biopsies, six were reported as AR, two were reported as ATN, and one was reported as no evidence of ATN or rejection. Four of six patients with AR had positive C4d staining in the peritubular capillary region suggestive of AMR, and the remaining two patients had TMR.
The mean age of the normal functioning group was 38.3 ± 11.1 years, the mean age of AR group was 32.5 ± 10.1 years, and the mean age in ATN group was 32.5 ± 2.0 years [Table 1].

The mean cortical and medullary R2* values as well as the mean corticomedullary gradient (medullary R2*:cortical R2*) in the normal functioning recipient group, AR group, and the ATN group are summarized in Table 2. The mean medullary R2* was significantly higher in ATN group compared with AR (P < 0.001) and normal group (P = 0.030) [Figures 5 and 6]. The mean medullary R2* of AR group was significantly lower when compared with normal group (P < 0.001). Similarly, cortical R2* of ATN group was significantly higher compared with AR (P < 0.001) and normal group (P < 0.001). Cortical R2* values of AR group were significantly lower compared with normal (P < 0.001). There was no statistically significant difference in corticomedullary gradient between ATN and normal functioning group (P = 0.827); however, corticomedullary gradient of AR group was significantly lower compared with ATN (P = 0.016) and normal group (P < 0.001). Medullary R2*:cortical R2* ratio was significantly lower in AR group compared with normal group (P < 0.001), whereas no significant difference was noted between ATN and normal group (P = 0.347). No significant statistical difference was noted in mean medullary R2*, cortical R2*, corticomedullary gradient, and medullary: cortical R2* ratio between the 15 donors and patients with normal graft function [Table 3].


- (a) R2* map of a normal functioning allograft patient. (b) Region of interest placement in the cortex and medulla demonstrating the lower cortical R2* compared with the medullary R2* suggestive of decreased oxygenation of the medulla compared with the cortex

- (a) R2* map of an allograft with acute rejection. (b) Region of interest placement in the cortex and medulla demonstrating the decreased medullary R2* and loss of gradient between cortex and medulla compared to normal functioning allograft

Hemoglobin levels showed a significant linear correlation with medullary R2* levels (P = 0.043). The remaining factors such as serum creatinine levels, mean arterial pressure, serum tacrolimus levels, day of MRI after transplantation, and age showed no significant correlation with R2* levels.
Discussion
Invasive measurements of kidney function and oxygenation obtained in animals have revealed a correlation between intrarenal oxygenation and functional activity of kidney.[131415161718] In this study, we have compared the changes on BOLD MRI between those with ATN, AR, and normal clinical course. Of 40 participants, 32 had normal functioning allografts and 6 had biopsy-proven AR, whereas 2 had biopsy-proven ATN. The difference in medullary and cortical R2* values on BOLD MRI was compared among the two causes of acute early graft dysfunction and correlated with histopathological findings [Figures 7 and 8].

- (a) R2* map of an acute rejection allograft with lower medullary R2* values and decreased difference between medullary and cortical R2* values. (b) Biopsy of the allograft showing moderate tubulitis (arrow) and interstitial edema suggestive of acute cellular (T-cell mediated) rejection, PAS stain ×200 original magnification

- (a) R2* map of an acute tubular necrosis allograft with higher medullary R2* and cortical R2* values and maintained corticomedullary gradient. (b) Biopsy of the allograft showing acute tubular necrosis (arrow), PAS ×1000 original magnification
Factors affecting R2*
Furosemide and water loading inhibit active reabsorption of solutes in medullary tubular epithelial cells, and thus significantly improve medullary oxygen bioavailability.[1920] ACEIs and ARBs have pharmacological action of vasodilatation of the efferent glomerular arterioles[2122] and they increase blood supply to the medulla raising the medullary oxygen availability. All patients in our study were refrained from water ingestion or intravenous transfusion 4 h before BOLD MRI and had no diuretic agents, ACEI, or ARB. No correlation between characteristics such as patient age, time from operation to imaging, serum creatinine level, mean arterial pressure, blood tacrolimus trough concentration, and R2* levels were observed, except between hemoglobin levels and medullary R2* level which could be explained by increased oxygen delivery to medulla at higher hemoglobin levels. However, there was no significant difference in the mean hemoglobin level between different groups, and therefore the influence of hemoglobin levels on R2* value in different groups would not have been significant.
Variation and reproducibility of R2*
The absolute values of R2* vary widely in the literature. R2* values are influenced by various external and internal factors. Most of the earlier studies were done on 1.5T magnet and few recent studies on 3T magnet. Li et al. in their study of R2* values at 3T showed that medullary R2* values were nearly double when compared to 1.5T magnet.[23] Park et al. investigated whether different gradient echoes affect R2* values in healthy volunteers and patients with normal allografts.[24] They found no significant difference in cortical or medullary R2* values between healthy kidneys and normal allografts for gradient echoes of 8 (maximum TE 26 ms), 16 (maximum TE, 42 ms), or 20 (maximum TE, 50 ms). These results suggest that the number of echoes does not significantly affect R2* values of human kidneys.[24] In our study, we have used 16 echoes (maximum TE 32.8 ms) to determine R2* values. The studies in literature show marked variation in scanning parameter and technique sequences, and hence a direct comparison with our R2* values cannot be done. For BOLD MRI to be clinically useful, it has to be reproducible. Reproducibility of BOLD MRI has been studied by various authors in both short- and long term.[1925] Hence, we have not analyzed the reproducibility of measured R2* values.
Acute rejection allografts
In our patients with allografts AR, the mean cortical R2* and mean medullary R2* values were significantly lower compared with ATN and normal functioning groups. This suggests that the renal oxygen bioavailability increased and deoxyhemoglobin concentration decreased significantly in AR allografts. Oxygen bioavailability in medulla seemed to change more remarkably. Djamali et al. showed that the mean medullary R2* levels were significantly higher in normal functioning allografts compared with AR and ATN. The lowest MR2* levels were observed in AR episodes with vascular injury, that is, IIA and C4d(+). The lowest medullary: cortical R2* ratios were seen in allografts with IIA and C4d(+) rejection.[26] In a study by Han et al., AR group was subdivided into two groups: acute TMR (n = 13) and acute AMR (n = 8) according to Banff’05 criteria.[27] The mean MR2* level was significantly lower in AR group compared with normal and ATN groups. There was no significant difference in CR2* and MR2* values between AMR subgroup and TMR subgroup. In our study, we have not subdivided AR group into AMR and TMR due to small sample size. In a study using 3T magnet, Liu et al. found no significant differences of cortical R2* value among the three groups.[28]
Acute tubular necrosis allografts
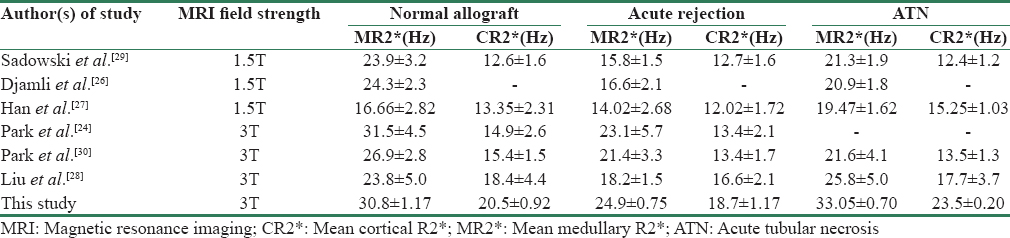
In our study, ATN allografts showed increased R2* values in cortex and medulla suggesting decreased oxygen bioavailability both in the cortex and medulla compared with normal functioning allografts. In the study by Han et al., the cases of ATN showed higher values of medullary R2* compared with normal allografts, which is similar to our observation.[26] Similar results were observed in a study by Liu et al.[28] However, Djamali et al. found that medullary R2* levels of ATN allografts were lower than normal functioning allografts,[26] reflecting a significant increase in medullary oxygen bioavailability in ATN allografts, which is different from our results. In the early stage of acute intrarenal ischemia, the compromise of blood supply decreases the renal blood flow, which could result in elevation of cortical R2* and medullary R2* levels. The reduced glomerular filtration rate, distal delivery, and reabsorption rate under low renal blood flow lead to decreased oxygen consumption which could cause increased oxygen availability in the allografts during the recovery of ATN. The time from transplant surgery to BOLD MRI was longer in the study of Djamali et al. (average time = 29 days), which is different from our study (average time = 10.5 days) and study by Han et al. (average time = 9.8 days). Han et al. suggested that this time difference may signify various pathophysiological phases of ATN, and compensatory increase in oxygenation may be noted in patients who are in recovering phase of ATN.[27] Medullary R2* changes in our study were more prominent compared with cortical R2* and were significantly different among the three groups as observed in all previous studies [Table 4]. Cortical R2* values observed in our study showed significant difference between the three groups with AR group having the lowest CR2* and ATN group having the highest CR2* value; this finding was similar to the observation of Han et al.[27] However, our observation is different from that of Sadowski et al.[29] and Liu et al.[28] In their studies, there was no significant difference in cortical R2* among the three different groups. Our findings also differ from those made by Park et al. in which no significant difference was found in R2* or ADC (Apparent diffusion coefficient) values between AR and ATN.[30] In earlier studies performed on 1.5T, the lack of discrimination between AR and ATN is possibly due to (1) relatively small population of AR or ATN in the study group,[30] (2) presence of a wide spectrum of pathologic changes in the cortex and medulla in AR or ATN,[3132] and (3) clinical or treatment-related variables such as administration of intravenous fluid, inhalational oxygen, and drugs. In our study, we obtained variation in R2* values in AR and ATN; in severe ATN, R2* value increases but still does not reach the values similar to AR.
Pre- and post-transplantation BOLD MRI
We also studied 15 donors before graft harvesting using BOLD MRI and compared R2* values of the same renal moiety after transplantation. There was no significant difference in medullary R2* and cortical R2* values of the normal functioning allograft and their donor state. To the best of our knowledge, there are no studies in current literature comparing R2* values before and after transplantation in the same renal moiety. Park et al. compared normal volunteers and normal functioning allografts and found there was no significant difference in R2* values of cortex and medulla between the groups. This suggests that there are no significant oxygenation changes in the normal volunteer kidneys and normal functioning allograft kidneys.[24]
Our study has a few limitations. All except one patient in our study were live-related donors while most of the published data are on cadaveric transplants and hence not exactly comparative. The number of patients investigated with biopsy-proven AR (n = 6) and ATN (n = 2) was also smaller compared with the number of patients with normal graft function group (n = 32). Furthermore, BOLD MRI cannot distinguish between the changes in oxygen supply and local oxygen consumption; it only reflects the relative deoxyhemoglobin levels in tissue. Large multi-center studies with standardized BOLD MRI protocols are needed to standardize the results of BOLD MRI and R2* values. These results will help us understand the oxygenation and metabolism of kidney in various pathologies and hopefully reduce the need for invasive percutaneous biopsy in post-transplant patients with early graft dysfunction.
Conclusion
BOLD MRI has the potential to be useful as a tool for discriminating between acute rejection and acute tubular necrosis in early renal allograft dysfunction. R2* values are significantly decreased in AR allografts and increased in an early stage of ATN, indicating the changes in tissue oxygen bioavailability and deoxyhemoglobin concentration.
Financial support and sponsorship
Nil.
Conflicts of interest
There are no conflicts of interest.
References
- Posttransplantation acute tubular necrosis: Risk factors and implications for graft survival. Am J Kidney Dis. 1998;32:984-91.
- [Google Scholar]
- Delayed graft function: Risk factors and implications for renal allograft survival. Transplantation. 1997;63:968-74.
- [Google Scholar]
- Valvular heart disease/peripheral arteries/renal disease: Noninvasive evaluation of intrarenal oxygenation with BOLD MRI. Circulation. 1996;94:3271-5.
- [Google Scholar]
- Changes in intrarenal oxygenation as evaluated by BOLD MRI in a rat kidney model for radio contrast nephropathy. J Magn Reson Imaging. 2001;13:744-7.
- [Google Scholar]
- Breath-hold R2* mapping with a multiple gradient-recalled echo sequence: Application to the evaluation of intrarenal oxygenation. J Magn Reson Imaging. 1997;7:1163-5.
- [Google Scholar]
- Effect of diabetes on renal medullary oxygenation during water diuresis. Diabetes Care. 2002;25:575-8.
- [Google Scholar]
- Kidneys in hypertensive rats show reduced response to nitric oxide synthase inhibition as evaluated by BOLD MRI. J Magn Reson Imaging. 2003;17:671-5.
- [Google Scholar]
- Visualization and quantification of renal R2* changes during water diuresis. J Magn Reson Imaging. 2003;17:676-82.
- [Google Scholar]
- Blood oxygen level-dependent measurement of acute intra-renal ischemia. Kidney Int. 2004;65:944-50.
- [Google Scholar]
- Etiology of early renal allograft dysfunction after live donor renal transplantation. Transplant Proc. 1998;30:1320.
- [Google Scholar]
- Banff ‘05 Meeting Report: Differential diagnosis of chronic allograft injury and elimination of chronic allograft nephropathy (’CAN’) Am J Transplant. 2007;7:518.
- [Google Scholar]
- Oxygen and renal hemodynamics in the conscious rat. J Am Soc Nephrol. 2000;11:1-24.
- [Google Scholar]
- Hypoxia of the renal medulla: Its implications for disease. N Engl J Med. 1995;332:647-55.
- [Google Scholar]
- Determinants of intrarenal oxygenation I Effects of diuretics. Am J Physiol. 1994;267(pt 2):F1059-62.
- [Google Scholar]
- Determinants of intrarenal oxygenation II Hemodynamic effects. Am J Physiol. 1994;267(pt 2):F1063-8.
- [Google Scholar]
- Evaluation of the reproducibility of intrarenal R2* and Delta R2*measurements following administration of furosemide and during waterload. J Magn Reson Imaging. 2004;19:610-6.
- [Google Scholar]
- Changes in renal medullary pO2 during water diuresis as evaluated by blood oxygenation level-dependent magnetic resonance imaging: Effects of aging and cyclooxygenase inhibition. Kidney Int. 1999;55:294-8.
- [Google Scholar]
- Renal hemodynamic actions of angiotensin II: Interaction with tubuloglomerular feedback. Am J Physiol. 1983;245:R166-73.
- [Google Scholar]
- Angiotensin II decreases the renal MRI blood oxygenation level-dependent signal. Hypertension. 2006;47:1062-6.
- [Google Scholar]
- Evaluation of intrarenal oxygenation by BOLD MRI at 3.0 T. J Magn Reson Imaging. 2004;20:901-4.
- [Google Scholar]
- Evaluation of transplanted kidneys using blood oxygenation level-dependent MRI at 3 T: A preliminary study. AJR Am J Roentgenol. 2012;198:1108-14.
- [Google Scholar]
- Non-invasive monitoring of renal oxygenation using BOLD-MRI: A reproducibility study. NMR Biomed. 2006;19:84-9.
- [Google Scholar]
- Noninvasive assessment of early kidney allograft dysfunction by blood oxygen level-dependent magnetic resonance imaging. Transplantation. 2006;82:621-8.
- [Google Scholar]
- The significance of BOLD MRI in differentiation between renal transplant rejection and acute tubular necrosis. Nephrol Dial Transplant. 2008;23:2666-72.
- [Google Scholar]
- Detection of renal allograft rejection using blood oxygen level-dependent and diffusion weighted magnetic resonance imaging: A retrospective study. BMC Nephrol. 2014;15:158.
- [Google Scholar]
- Assessment of acute renal transplant rejection with blood oxygen level-dependent MR imaging: Initial experience. Radiology. 2005;236:911.
- [Google Scholar]
- Assessment of early renal allograft dysfunction with blood oxygenation level-dependent MRI and diffusion-weighted imaging. Eur J Radiol. 2014;83:2114-21.
- [Google Scholar]
- Banff 07 classification of renal allograft pathology: Updates and future directions. Am J Transplant. 2008;8:753-60.
- [Google Scholar]
- Interstitial alterations in renal cortex in acute tubular necrosis (ATN) post-renal transplantation and in patients with ATN not related to renal transplant. Clin Transplant. 2004;18:156-65.
- [Google Scholar]