

Translate this page into:
Volume Assessment in Hemodialysis: A Comparison of Present Methods in Clinical Practice with Sonographic Lung Comets
This is an open access journal, and articles are distributed under the terms of the Creative Commons Attribution-NonCommercial-ShareAlike 4.0 License, which allows others to remix, tweak, and build upon the work non-commercially, as long as appropriate credit is given and the new creations are licensed under the identical terms.
This article was originally published by Medknow Publications & Media Pvt Ltd and was migrated to Scientific Scholar after the change of Publisher.
Abstract
Dry weight assessment in dialysis patients remains a challenging endeavor owing to the limitations of the available methods for volume assessment. Lung ultrasound is emerging as an invaluable tool to assist in the appropriate assessment and assignment of dry weight. The objectives of this study are (1) to determine the reliability of clinical signs and symptoms for volume assessment, (2) to compare lung ultrasound with High Resolution Computed Tomography (HRCT) chest-A noninvasive gold standard tool for detecting pulmonary congestion and with inferior vena cava diameter (IVCD) – another time-tested volume assessment method, and (3) to analyze if lung ultrasound could detect dialysis induced fluid status variations. The cross-sectional study involves 50 patients on maintenance hemodialysis. Lung ultrasound for B line estimation and ultrasonographic measurement of IVCD performed before and after hemodialysis by a nephrologist trained in ultrasonography. Limited HRCT was obtained just before hemodialysis. Edema, crackles, and dyspnea had a poor sensitivity of 37.9%, 11.5%, and 52.6%, respectively, to detect clinically significant pulmonary congestion by lung ultrasound. A highly significant correlation was obtained between B-line score and HRCT signs of pulmonary congestion (P < 0.001) before dialysis. B lines showed statistically significant reduction with dialysis. The absolute reduction of B lines showed significant correlation with ultrafiltration volume and weight loss. Bedside lung ultrasound appears a sensitive tool for evaluating real-time changes in extravascular lung water and would serve to optimize volume status in dialysis patients.
Keywords
B lines
hemodialysis
high-resolution computed tomography
lung ultrasound

Introduction
The concept of dry weight in patients on maintenance dialysis remains an illusion than a reality.[1] The quest for noninvasive volume assessment tools to aid in the reliable and reproducible estimate of dry weight continues. Dry weight or the optimum postdialysis weight is defined as the weight at which all or most excess of body fluid has been removed and below which further fluid removal would produce hypotension, muscle cramps.[2] Achieving an optimal dry weight remains a complex issue, considering the need to take into account individual patient's hemodynamic tolerance and cardiac performance. In most centers, dry weight is determined clinically, based on a trial-and-error method, and does not account for changes in nutritional status and lean body mass.[3] Assessment of volume status by clinical evaluation is imprecise and often unreliable. Both overestimation and underestimation of dry weight is fraught with complications and associated with significant morbidity and mortality.[4] Moderate–severe lung congestion is a strong predictor of death and cardiovascular events and provides prognostic information independent of New York Heart Association (NYHA) class, other traditional and nontraditional risk factors in patients on maintenance hemodialysis.[5] Methods of volume assessment have evolved from clinical evaluation to bioimpedence spectroscopy, indexed inferior vena cava diameter (IVCD) measurement with ultrasonography, blood volume (Crit line) monitoring, and estimation of B-line score (lung comet score) with lung ultrasonography.[6] Bioimpedance spectroscopy and echocardiographic assessment of volume status are limited by their cost and bedside availability. With its noninvasiveness, freedom from radiation, ease of use, acceptable intra/inter-operator reproducibility, and availability of portable ultrasound devices in dialysis units, lung ultrasonography can be considered one of the most interesting “cards to play” for near-precise assessment of volume status in patients on maintenance hemodialysis.[7]
In the light of this background, we aimed
-
To determine the sensitivity and specificity of clinical signs and symptoms to detect pulmonary congestion with HRCT and lung ultrasound as the reference tests and to evaluate the association of clinical signs and symptoms with the various imaging methods employed in the study
-
To estimate the prevalence of asymptomatic pulmonary congestion by lung ultrasound
-
To assess the correlation between HRCT signs of hydrostatic lung edema with the lung comet score before dialysis
-
To assess the correlation between indexed IVCD/inferior vena cava collapsibility index (IVCCI) pre- and post-hemodialysis
-
To analyze if lung ultrasound could detect the fluid status variations induced by hemodialysis.
Methods
Cross-sectional study was done involving 50 stable CKD 5D patients >18 years of age on maintenance hemodialysis for at least 3 months at our hemodialysis unit. Patients with interstitial lung disease, pulmonary hemorrhage, congestive heart failure NYHA Class III, IV, left ventricular ejection fraction <45%, Grade 2 diastolic dysfunction or higher, pericardial effusion, episodes of acute pulmonary edema/pulmonary infection in the last 2 months, BMI >30 kg/m2, and patients who did not consent for the study were excluded.
Patients were subjected to thorough history taking with special concern on grade of dyspnea (assessed by NYHA classification), meticulous clinical examination before and after dialysis including vital signs and features of hypervolemia like fine basal crepitations, and lower limb edema. Routine laboratory investigations (complete blood count, serum creatinine, urea, electrolytes, serum albumin) were done once before dialysis. All patients were subjected to echocardiographic assessment prior to study entry.
Comorbidities, dialysis prescription, all episodes of intradialytic hypotension, cramps, and postdialysis fatigue were recorded. Radiological examinations including ultrasound lung comet score and measurement of hepatic portion of IVCD were done within 60 min prior to and post-hemodialysis by the principal investigator blinded to the results of clinical examination, patients' weight variables, and dialysis prescription. Limited HRCT chest was obtained in all patients just prior to hemodialysis. Nephrology resident (principal investigator) involved in the study was trained in lung ultrasound and IVCD measurement by an expert radiologist and had performed 50 preparatory supervised lung ultrasound examinations prior to the study. The entire process was overseen by a senior faculty from the department of radiodiagnosis throughout the period of study.
Institutional ethical committee clearance was obtained and the patients who were recruited had given their written informed consent in vernacular language to be a part of the study.
Study variables
-
Dry weight: Weight estimated by the treating nephrologist based on patient's clinical criteria like edema, crackles, blood pressure, intradialytic episodes of hypotension, or cramps
-
Weight gain: Increase in weight from the subjective dry weight
-
Residual weight: Difference between the weight obtained after dialysis and the subjective dry weight
-
Weight loss: Difference between weight recorded before and after dialysis.
The weight was recorded on a single digital weighing machine which was calibrated daily.
Clinical examination
Patients were classified into groups according to the presence (NYHA Class II, III, IV) or absence (NYHA Class I) of dyspnea.
Limited high-resolution chest tomography
Limited HRCT was obtained at three levels – Arch of aorta, Hilum, and Base. The effective radiation dose with a limited HRCT is quite similar to that of chest radiograph.[8] HRCT findings of hydrostatic lung edema-smooth interlobular septal thickening (denoted as CT lines in our study) and ground glass opacities (GGOs) were studied [Figures 1–3]. The visceral pleura and subpleural interstitium along the costal surfaces of lung are not visible on HRCT in normal subjects. On HRCT, numerous clearly visible interlobular septa almost always indicate the presence of an interstitial abnormality – fluid (smooth uniform thickening), fibrosis (irregular thickening), or infiltration while only a few septa are visible in normal patients.[9] CT lines were counted in the nondependent areas of the lung in both right and left hemithorax to allow for the normal minimal fluid accumulation in dependent areas of the lung. An arbitrary cutoff of 20 was taken, above which CT lines were considered abnormal. GGO is a hazy increase in lung attenuation that does not obscure the underlying vessels unlike consolidation which does.[9] Diffuse or patchy distribution of these GGOs was noted.
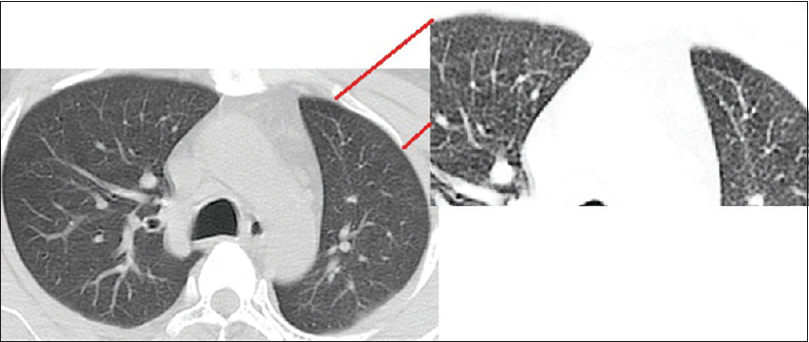
- High-resolution computed tomography showing smooth interlobular septal thickening (computed tomography lines) with closer view

- High-resolution computed tomography showing patchy ground glass opacity

- High-resolution computed tomography showing diffuse ground glass opacity
We proposed a grading system for the above findings as follows:
-
CT lines in nondependent areas: Mild – 20–39, moderate – 40–60, severe >60
-
GGOs were interpreted as absent/patchy/diffuse.
Lung ultrasound
Ultrasound examination of the anterolateral chest was carried out with longitudinal scan of the right and left hemithoraces, from the second to the fourth (on the right side up to the fifth) intercostal space with a 7–12-MHz linear probe (ultrasound machine – Aloka Prosound SSD-4000SV). In each intercostal space, the number of B lines was counted at the parasternal, midclavicular, anterior axillary, and midaxillary lines, and a total of 28 sectors were examined. The total number of B lines was the sum of the artifacts recorded in the 28 sectors explored, yielding a score called the B-line score or the lung comet score[10] [Figure 4]. B lines were defined by the following criteria:[11] Hyperechogenic lines were perpendicular to probe surface, origination at the pleural line, extension to the lower limit of the field, independence from A line, synchronous movement with pleural sliding. Patients were classified into three grades on the basis of their B lines (lung comet score): mild 5–14, moderate 15–30, and severe >30.[12] Clinically significant pulmonary congestion was taken as B-line score ≥5 in our study.

- Lung ultrasound showing B line (comet)
Ultrasound measurement of inferior vena cava diameter
The IVCD was explored within the subxiphoid window with a 3–5-MHz convex probe during inspiration and expiration at 2.0 cm from the cavoatrial junction. Body surface area was calculated using Dubois formula. Inspiratory variations of IVC Diameter are shown in Figure 5.

- Respiratory variations in inferior vena cava diameter; red line shows the landmark for measuring inferior vena cava diameter – about 2 cm from inferior vena cava right atrial junction (yellow line)
The following parameters were calculated:
IVCDimax (indexed end expiratory inferior vena = End expiratory IVCD/BSA (mm) cava diameter)
IVCDimin (indexed end inspiratory inferior = End inspiratory IVCD/BSA (mm) vena cava diameter)
IVC collapsibility index (IVCCI)% = IVCDimax − IVCD imin/IVCDimax.
With respect to IVCDimax measurement before and after dialysis, patients were classified into three groups: hypovolemia <8 mm, euvolemia 8–11.5 mm, and hypervolemia > 11.5 mm.[13]
Statistical analysis
Data were analyzed using IBM SPSS Software Version 23.0. Percentage analysis was used for categorical variables; mean and standard deviation were used for continuous variables. Pearson's correlation and Spearman's correlation tests were used to assess the relationship between variables. Mann–Whitney U test was used to assess the association between clinical signs/symptoms and imaging modalities. Chi-Square test and Wilcoxon's sign rank test were used as tests of significance for categorical variables. Relationship between various parameters was evaluated using analysis of linear regression. P value 0.05 was considered statistically significant.
Results
Of the total study population (n = 50), 74% were males. The distribution of native kidney disease was unknown in 62%, IgA nephropathy and diabetic kidney disease in 14% each, reflux nephropathy in 8%, and anti-GBM disease in 2%. The demographic and clinical profiles of the study population are summarized in Table 1.
| Variables | Values |
|---|---|
| Age (mean±SD) | 37.12±10.802 |
| HD duration (months) (median, IQR) | 8 (3.0-24.0) |
| HB (g/dl) | 8.344±1.67 |
| Albumin (g/dl) | 3.322±0.45 |
| BMI | 5.4 |
| Ejection fraction (%) | 57.5±5.5 |
| Pre-HD weight (kg) | 53.724±10.7 |
| Dry weight (kg) | 51.068±10.5 |
| Weight gain (kg) | 2.660±1.1 |
| Post-HD weight (kg) | 51.254±10.4 |
| Weight loss (kg) | 2.472±1.02 |
| Residual weight (g) | 100 (−25 to+300) |
| Ultrafiltration (ml) | 2746.00±985.24 |
| Urine output (ml) | 300 (100-500) |
BMI: Body mass index, IQR: Interquartile range, HD: Hemodialysis
All patients completed the protocol as the feasibility of ultrasound was 100% for lung comet scoring and IVCD measurement. The total duration of examination did not exceed 15 min each time.
Predialysis
Association of clinical signs and symptoms with high-resolution computed tomography, lung ultrasound, inferior vena cava diameter
Edema, crackles, and dyspnea each showed a strong association with the CT lines of HRCT (P-value = 0.01, 0.028, and 0.009, respectively) and the B-line score of lung ultrasound (P value <0.001, 0.032, and <0.001, respectively) using Mann–Whitney U test analysis. Patients who presented with clinical signs and symptoms had a higher median CT line score and B-line score compared to patients who had neither of these signs and symptoms. On the other hand, except for symptoms of dyspnea which showed a strong association with end expiratory IVCD (P = 0.006), crackles and edema showed a weak association (P = 0.848, 0.08, respectively) [Table 2].
| Symptom* | CT lines median (IQR) | P | Lung comet score Median (IQR) | P | IVCDimax Median (IQR) | P |
|---|---|---|---|---|---|---|
| Edema | ||||||
| Positive | 58 (43-63) | 0.01 | 25 (12-41) | <0.001 | 12.16 (9.2-14.5) | 0.08 |
| Negative | 15 (8-45) | 4 (2-12) | 9.73 (8.2-12.44) | |||
| Crackles | ||||||
| Positive | 63 (60-∞) | 0.028 | 34 (13-∞) | 0.032 | 9.9 (8.9-∞) | 0.848 |
| Negative | 17 (10-56) | 5 (2-14) | 10 (8.1-12.6) | |||
| Dyspnea | ||||||
| Positive | 61 (53-65) | <0.001 | 34 (16-44) | <0.001 | 13.3 (10.9-14.9) | 0.006 |
| Negative | 15 (8-40) | 4 (1-12) | 9.7 (8.1-12.4) | |||
*Mann–Whitney U-test analysis. CT: Computed tomography, IQR: Interquartile range, IVCD: Inferior vena cava diameter
Receiver operating characteristic curve analysis
The sensitivity of edema, crackles, and dyspnea to detect significant pulmonary congestion by HRCT (CT lines ≥20) were 44%, 12%, and 40%, respectively. Using lung ultrasound as the reference test, the sensitivity of clinical signs and symptoms to detect pulmonary congestion (B line ≥5) was 37.9% for edema, 52.6% for dyspnea, and 11.5% for crackles. The clinical signs and symptoms despite their poor sensitivity had a very high specificity – edema, crackles, and dyspnea had a specificity of 96%, 100%, and 100%, respectively, with HRCT as reference test/95%, 100%, and 100%, respectively, with lung ultrasound as reference test. Lung comet grades in the absence of clinical signs and symptoms are shown in Figure 6.

- Grades of pulmonary congestion by lung ultrasound in the absence of clinical signs and symptoms
Postdialysis
Association of clinical signs and symptoms with high-resolution computed tomography, lung ultrasound, inferior vena cava diameter
While edema and dyspnea showed a strong association with B-line score, similar to the trend noted predialysis, their association with IVCDimax was poor [Table 3]. As only one patient in our study had crackles at the end of dialysis, a meaningful association could not be derived. Nearly one-third of patients had clinically significant B-line score despite the absence of edema or crackles at the end of dialysis. Importantly, moderate or severe pulmonary congestion by lung ultrasound was seen in 30% of patients without crackles and 24% without edema.
| Symptom* | Lung comet score Median (IQR) | P | IVCDimax Median (IQR) | P |
|---|---|---|---|---|
| Edema | ||||
| Positive | 11 (5-23) | <0.006 | 8 (6.81-10.3) | 0.41 |
| Negative | 2 (1-7) | 7.69 (5.5-9.9) | ||
| Dyspnea | ||||
| Positive | 23 (15-25) | <0.001 | 9.3 (8.2-10.5) | 0.2 |
| Negative | 2 (1-6) | 7.56 (5.7-9.9) | ||
*Mann–Whitney U-test analysis. IVCD: Inferior vena cava diameter, IQR: Interquartile range
Receiver operating characteristic curve analysis
On analyzing area under ROC curve, the sensitivity of edema, crackles, and dyspnea to detect pulmonary congestion by lung ultrasound postdialysis were as low as 36.5%, 5%, and 21%, respectively, with a high specificity (93%, 100%, and 100%, respectively).
Intra/Postdialytic complications
Cramps
Twelve patients complained of cramps toward the end of dialysis. Ninety-one percent of these patients had no evidence of pulmonary congestion (lung comets < 5) by lung ultrasound, suggestive of euvolemia/volume depletion. All these patients were hypovolemic by IVCD criteria.
Hypotension
Intradialytic hypotension occurred in one patient with no detectable B line.
Postdialysis fatigue
Patients with symptoms of postdialysis fatigue (n = 3) were volume depleted by IVCD measurement and had no clinically significant pulmonary congestion by lung ultrasound.
Patients with cramps had a median B-line score of 2 and IVCDimax of 6.1 mm. On a similar note, patients with fatigue demonstrated a median B-line score of 2 and IVCDimax of 5.6 mm.
Asymptomatic pulmonary congestion
Asymptomatic pulmonary congestion absence of dyspnea despite clinically significant pulmonary congestion by lung ultrasound (lung comet score ≥5) was prevalent in 47.5% of our patients before dialysis.
High-resolution computed tomography signs of hydrostatic edema and lung comet score
A schematic representation of the relationship between fluid status, HRCT signs, IVCD, and B lines is shown in Figure 7. With the imaging performed just before dialysis, lung comet score has shown a highly significant positive linear correlation with the smooth interlobular septal thickening (CT lines) indicative of lung interstitial edema in HRCT (r 0.645, P < 0.001) depicted in Figure 8. Patchy/Diffuse GGOs in HRCT which represent alveolar edema showed a linear positive correlation with increasing lung comet grade. Diffuse GGOs were seen in all patients with severe pulmonary congestion by lung ultrasound (B lines >30).

- Schematic representation showing the normal relationship of high-resolution computed tomography signs/inferior vena cava diameter/B lines with fluid status

- Correlation between lung sonographic comets and smooth interlobular septal thickening (computed tomography lines) in high-resolution computed tomography
On ROC curve analysis, we found that a B-line score of 7 had a sensitivity and specificity of 70% and 80%, respectively, to detect significant pulmonary congestion by HRCT (CT lines >20). B-line score of 12 had a high specificity of 92% for CT line score ≥20.
Correlation between lung comet score and inferior vena cava diameter
Lung comet score has shown a good correlation with IVCDimax (r = 0.414, P = 0.003) and IVCCI (r = −0.323, P = 0.002) measured before dialysis. Although postdialysis following fluid removal, the correlation between lung comet score and IVCCI (r = −0.106, P = 0.46) was weak and insignificant. Absolute reduction of B lines did not correlate significantly with absolute reduction of IVCDimax (r = 0.215, P = 0.13). Results are tabulated in Table 4.
| IVCDi max (BD) | IVCCI % (BD) | IVCDi max (AD) | IVCCI % (AD) | Absolute reduction in IVCDimax | |
|---|---|---|---|---|---|
| Lung comet score (BD) | |||||
| R | 0.414* | −0.323** | |||
| P | 0.003 | 0.02 | |||
| Lung comet score (AD) | |||||
| R | 0.351 | −0.106** | |||
| P | 0.02 | 0.46 | |||
| Absolute reduction of B line | |||||
| R | 0.215 | ||||
| P | 0.13 |
*Pearson’s correlation, **Spearman’s correlation. P<0.5 statistically significant. IVCD: Inferior vena cava diameter, BD: Before dialysis, IVCCI: Inferior vena cava collapsibility index, AD: After Dialysis
Fluid status variations induced by hemodialysis
A statistically significant reduction in the number of B lines and IVCD was observed at the end of dialysis compared to the predialytic values (P < 0.001). On the other hand, the IVC collapsibility index which is a measure of the IVC compliance has increased significantly with fluid removal postdialysis [Table 5 and Figure 9].
| Variable | Predialysis | Postdialysis | P |
|---|---|---|---|
| B lines (median, IQR)* | 6 (2.75-16.25) | 2.5 (1.00-10.00) | <0.001 |
| IVCDimax (mm), (mean±SD)** | 10.7±2.97 | 7.9±2.5 | <0.001 |
| IVCDimin (mm), (median, IQR)* | 7.98 (4.76-9.94) | 5.0 (3.2-7.5) | <0.001 |
| IVCCI %, (median, IQR)* | 28.6 (13.2-42.9) | 31.4 (24.6-44.5) | 0.01 |
| Systolic blood pressure (mmHg)** | 153.00±22.6 | 154.20±28.5 | 0.72 |
| Diastolic blood pressure (mmHg)** | 95.00±19.5 | 91.82±19.5 | 0.32 |
*Wilcoxon’s sign rank test, **paired t-test. IVCCI: Inferior vena cava collapsibility index, IVCD: Inferior vena cava diameter, IQR: Interquartile range

- Fluid status before and after hemodialysis estimated by lung ultrasound and inferior vena cava diameter
Correlation between ultrafiltration volume and B lines/inferior vena cava diameter
Ultrafiltration volume correlated significantly with absolute reduction in lung comet score (r = 0.52, P = 0.03) while no such correlation was observed with the absolute reduction in IVC diameter (r = 0.156, P = 0.28).
Weight changes and lung comet scores
Mean weight gain of our study population was 2.66 + 1.09 kg. At the end of hemodialysis, 11 patients attained their estimated dry weight (22%), 19 patients (38%) had residual weight of <500 g, 8 patients (16%) had residual weight of more than 500 g, while 12 patients (24%) attained postdialysis weight below their estimated dry weight. All patients who attained their estimated dry weight had no significant B lines on ultrasonography. On linear regression analysis, there was a highly significant correlation between absolute reduction of lung comet score and measured weight loss at the end of dialysis (r = 2.8, P = 0.007), in contrast to absolute change in IVCD which failed to correlate with weight loss (r = 0.173, P = 0.58) [Table 6]. Results were not significant when calculating linear regression between the following variables:
| Correlation between weight loss | Coefficient beta | P |
|---|---|---|
| Absolute reduction of B line | 2.8 | 0.007 |
| Absolute reduction of IVCDimax | 0.173 | 0.58 |
IVCD: Inferior vena cava diameter
-
Lung comet score and IVCDimax before dialysis with the weight gain (β = 2.94, P = 0.08/β = 0.52, P = 0.17)
-
Lung comet score and IVCDimax after dialysis with the residual weight (β = 0.002, P = 0.41/β = 0.001, P = 0.35).
Discussion
Hydrostatic pulmonary edema is defined as an abnormal increase in extravascular lung water (EVLW) secondary to elevated pressure in the pulmonary circulation, as in congestive heart failure or intravascular volume overload.[14] Majority of our study population (86%) had left ventricular ejection fraction >55%. Patients with significant left ventricular systolic and diastolic dysfunction were excluded from our study to judiciously exclude the contribution of congestive cardiac failure to pulmonary congestion. Monitoring EVLW which denotes fluid at the level of pulmonary interstitium has prima facie credibility as a biomarker for detecting pulmonary congestion[15] and can predate frank pulmonary edema by approximately 2 weeks. Lung ultrasound allows noninvasive reproducible estimate of EVLW.[7] B lines are the hyperechoic reverberations of ultrasonic waves between the pleura and edematous pulmonary septa. This characteristic finding is the equivalent of Kerley B lines seen on a routine chest X-ray.[16] The purpose of our study was to assess if lung ultrasound could be a feasible noninvasive bedside tool complementing clinical examination for appropriate assessment of dry weight. The reliability of auscultation for the diagnosis of lung congestion has recently been specifically assessed in the dialysis population. Investigators of Lung Water by Ultra-Sound Guided Treatment to Prevent Death and Cardiovascular Complications in High Risk ESRD Patients with Cardiomyopathy Trial (LUST) study adopted lung sonography as a reference test to examine the diagnostic reliability of crackles as a sign of pulmonary congestion. It was found that 61% of patients with moderate or severe pulmonary congestion by lung ultrasound (B-line score ≥15) had no crackles.[17] Similarly, absence of edema, despite marked pulmonary congestion, has been reported in ultrasound studies of patients on hemodialysis[17] and peritoneal dialysis.[18] Akin to these studies, we found that the routinely assessed clinical signs and symptoms were quite insensitive to detect interstitial lung edema as evidenced by their poor sensitivity. Absence of edema and crackles which are considered one of the end points for fluid removal during dialysis was not present in nearly one-third of our patients with significant pulmonary congestion by lung ultrasound. These findings highlight the errors inherent with estimation of optimal target weight based on clinical examination alone. HRCT and lung ultrasound aid in the identification of interstitial edema at a much earlier stage of pulmonary congestion, well before the patient presents with clinical signs and symptoms. The high specificity of clinical signs and symptoms suggest that when present, it should be considered clinically important.
All patients who developed cramps and intradialytic hypotension (other routinely used clinical end points below which further dry weight reduction is not done) had no significant B lines by lung ultrasound. This was further corroborated by the observation that all patients were hypovolemic by IVCD criteria. The variable association of the clinical signs and symptoms with each of the three modalities can be partly explained by the different fluid compartments estimated by these methods (intravascular compartment by IVCD, interstitial compartment by HRCT, and lung ultrasound). While patients with dyspnea and edema predialysis were hypervolemic by the IVCDimax criteria, there was no significant difference in the median IVCDimax of patients with and without crackles. This may suggest the presence of crackles in uremic lung independent of fluid overload, variation of IVCD with respiratory effort, or the questionable value of IVCD as a surrogate for volume status.[19] Both the median B-line score and IVCDimax were low as expected in patients with cramps, hypotension, and postdialysis fatigue, highlighting their excellent correlation with clinical indicators of volume depletion.
In addition to the significant contribution of fluid overload and left ventricular function to pulmonary congestion, the systemic inflammatory milieu in ESRD may increase alveolocapillary permeability (though its precise contribution to pulmonary congestion is unclear). Asymptomatic lung congestion is highly prevalent among patients with ESRD on maintenance hemodialysis.[202122] Zoccali et al. emphasized that B-line score could be a better predictor of the risk of death and cardiac events than NYHA score.[20] Asymptomatic pulmonary congestion has also been linked with poor physical performance in patients on maintenance HD independent of age, coexisting cardiovascular comorbidity, and nutritional markers.[23] Asymptomatic pulmonary congestion was prevalent in nearly 47.5% of our study population. Subclinical congestion is of peculiar relevance, because these patients have increased alveolocapillary permeability, which makes them vulnerable to volume overload that gradually builds up during the dialysis interval.[24] Targeting asymptomatic pulmonary congestion may help in averting emergency hemodialysis.
CT scan is considered the best method for a panoramic thoracic view and a much more sensitive tool for the first diagnosis of many conditions, like pulmonary embolism and early phase of cardiogenic pulmonary edema. On HRCT, signs of hydrostatic lung edema generally result in a combination of septal thickening (CT lines) and GGOs which indicate interstitial edema and alveolar edema, respectively.[25] As interstitial edema always precedes alveolar edema, smooth interlobular septal thickening usually points to early and GGOs to late air space filling or partial collapse of lung alveoli. The highly significant correlation between CT lines and lung comet score reinforces the potential usefulness of lung ultrasound in appreciating lung congestion at a much earlier preclinical stage as mentioned earlier. As expected, presence of GGOs correlated well with increasing lung comet score. To the best of our knowledge, ours is the first study to compare HRCT signs of pulmonary congestion with lung ultrasound B lines.
In our study, there was a significant correlation between lung comet score and IVCDimax, IVCCI% predialysis, and IVCDimax postdialysis. Postdialysis IVCCI% showed a weak correlation with lung comet score. Basso et al. in their work have emphasized that IVCD and IVCCI though sensitive for volume assessment predialysis have only modest sensitivity for detecting changes in fluid status postdialysis for reasons explained subsequently.[13]
A unique and interesting feature of lung ultrasound is its ability to quantitate reduction of B lines in real time during dialysis session and in proportion to fluid volumes removed by ultrafiltration.[26] Noble et al. were the first to show that there was a decrease of 2.7 B lines for every 500 ml of volume removed.[26] Later, this association between B-line reduction and ultrafiltration volume was confirmed in other[2127] but not all studies.[2829] The positive finding in our study supports the rapid clearance of lung imbibition with removal of excess fluid. If performed minutes before cessation of dialysis, lung ultrasound may facilitate prescription changes like extending duration of dialysis or increasing ultrafiltration volume to optimize volume status. This may be of significant value in patients with greater inter-dialytic weight gain (>5–6 kg) where excess fluid removal (>10–13 ml/kg/h) may cause myocardial stunning. Periodic lung ultrasound monitoring may help in planning our dialysis schedule and prescription in this high-risk group of patients. A more direct relationship between pulmonary B lines and volume status is further confirmed by the highly significant correlation between absolute reduction of B lines and weight loss.
The lack of a significant correlation between absolute reduction in IVCD with changes in B line, weight loss, and ultrafiltration volume could be explained by the fact that the two techniques evaluate different fluid compartments. While IVCD reflects the volume of intravascular water, B lines represent the volume of extravascular water. As re-equilibration of fluid from the interstitial to intravascular compartment takes time, the optimal time to perform IVCD measurement at the end of HD is not clearly defined and remains a limitation with this method.[13] Similar findings were noted in the work by Trezzi et al.[21] This again would explain the weak association between postdialysis edema and dyspnea with IVCDimax. On the other hand, lung ultrasound can be performed immediately after dialysis without any additional waiting time for the patient and provides clear-cut information about the pathological area of interest – that is pulmonary congestion.
Our small study population would probably explain the lack of a statistically significant correlation between predialysis lung comet score with weight gain and postdialysis comet score residual weight, different from other studies.[1327]
Limitations of lung ultrasound
B lines are also detected in other pulmonary conditions, even chronic, characterized by loss of aeration and increase in fluids.[30] It cannot distinguish between euvolemia and hypovolemia. This limitation can be circumvented by simultaneously measuring IVCD. B lines could also be caused by augmented lung permeability in uremic milieu of CKD regardless of systemic volume overload.[20] Whether better dialysis (longer or more frequent) might improve non-volume–related pulmonary congestion and eliminate B lines needs to be explored. Currently, the usefulness of targeting asymptomatic lung congestion remains unproven and requires randomized control trials to establish the same.
Limitations of our study
Owing to the cross-sectional nature of our study and the lack of follow-up data – it was not possible to establish the role of lung USG-based dry weight estimation to impact survival or cardiovascular outcomes. A small degree of observer bias was inevitable (principal investigator though blinded to clinical parameters was not blinded to the timing of evaluation (pre- or posttreatment). HRCT was not done post dialysis.
Conclusions
Lung ultrasound was clearly superior over clinical signs and symptoms for volume assessment in ESRD patients. The three clinical indicators – edema, crackles, and dyspnea, had a low sensitivity but high specificity when compared with HRCT and lung comet score both pre- and postdialysis. However, clinical indicators of volume depletion like cramps, hypotension, and postdialysis fatigue correlated well with hypovolemia by IVCD and lung ultrasound. Asymptomatic pulmonary congestion was prevalent in nearly one half of our study population. Lung ultrasound has shown excellent correlation with other proven methods of volume assessment like HRCT and indexed IVCD and is reliable for monitoring response to therapy in hemodialysis patients. Correlation with ultrafiltration and weight loss was better with lung ultrasound than IVCD. Bedside lung ultrasound by treating nephrologist in the hemodialysis room appears to be a promising tool for assessment of optimal target weight in dialysis patients if adopted alongside clinical examination.
Financial support and sponsorship
Nil.
Conflicts of interest
There are no conflicts of interest.
References
- Handbook of Dialysis. In: First Indian Reprint (5th ed). Philadelphia, USA: Wolter Kluwer Heath; 2015. p. :205-6.
- [Google Scholar]
- Assessment of dry weight in hemodialysis: An overview. J Am Soc Nephrol. 1999;10:392-403.
- [Google Scholar]
- Long-term survival rates in haemodialysis patients treated with strict volume control. Nephrol Dial Transplant. 2006;21:3506-13.
- [Google Scholar]
- Lung congestion as a risk factor in end-stage renal disease. Blood Purif. 2013;36:184-91.
- [Google Scholar]
- Comparison of multiple fluid status assessment methods in patients on chronic hemodialysis. Int Urol Nephrol. 2017;49:525-32.
- [Google Scholar]
- Average radiation exposure values for three diagnostic radiographic examinations. Radiology. 1990;177:341-5.
- [Google Scholar]
- HRCT Findings of Lung Disease, High Resolution CT of the Lung (3rd ed). Philadelphia, USA: Lippincott Williams and Wilkins; 2001. p. :355.:411.:413.
- Lung ultrasound: A novel technique for detecting fluid overload in children on dialysis. Nephrol Dial Transplant. 2017;32:541-7.
- [Google Scholar]
- Prognostic value of extravascular lung water assessed with ultrasound lung comets by chest sonography in patients with dyspnea and/or chest pain. J Card Fail. 2007;13:830-5.
- [Google Scholar]
- Comparison and reproducibility of techniques for fluid status assessment in chronic hemodialysis patients. Cardiorenal Med. 2013;3:104-12.
- [Google Scholar]
- Hydrostatic pulmonary edema: High-resolution CT findings. AJR Am J Roentgenol. 1995;165:817-20.
- [Google Scholar]
- Lung ultrasound in the management of fluid volume in dialysis patients: Potential usefulness. Semin Dial. 2017;30:6-9.
- [Google Scholar]
- Crackles and comets: Lung ultrasound to detect pulmonary congestion in patients on dialysis is coming of age. Clin J Am Soc Nephrol. 2016;11:1924-6.
- [Google Scholar]
- The agreement between auscultation and lung ultrasound in hemodialysis patients: The LUST study. Clin J Am Soc Nephrol. 2016;11:2005-11.
- [Google Scholar]
- Chest ultrasound and hidden lung congestion in peritoneal dialysis patients. Nephrol Dial Transplant. 2012;27:3601-5.
- [Google Scholar]
- Serial lung and IVC ultrasound in the assessment of congestive heart failure. Crit Ultrasound J. 2017;9:7.
- [Google Scholar]
- Pulmonary congestion predicts cardiac events and mortality in ESRD. J Am Soc Nephrol. 2013;24:639-46.
- [Google Scholar]
- Lung ultrasonography for the assessment of rapid extravascular water variation: Evidence from hemodialysis patients. Intern Emerg Med. 2013;8:409-15.
- [Google Scholar]
- Detection of pulmonary congestion by chest ultrasound in dialysis patients. JACC Cardiovasc Imaging. 2010;3:586-94.
- [Google Scholar]
- Pulmonary congestion in hemodialysis: An old chestnut worth screening for? Clin J Am Soc Nephrol. 2013;8:1279-81.
- [Google Scholar]
- Effectiveness of chest radiography, lung ultrasound and thoracic computed tomography in the diagnosis of congestive heart failure. World J Radiol. 2014;6:230-7.
- [Google Scholar]
- Ultrasound assessment for extravascular lung water in patients undergoing hemodialysis. Time course for resolution. Chest. 2009;135:1433-9.
- [Google Scholar]
- Lung ultrasound during hemodialysis: The role in the assessment of volume status. Int Urol Nephrol. 2014;46:169-74.
- [Google Scholar]
- Quantitative lung ultrasound comet measurement: Method and initial clinical results. Blood Purif. 2015;39:37-44.
- [Google Scholar]
- Predicting mortality in haemodialysis patients: A comparison between lung ultrasonography, bioimpedance data and echocardiography parameters. Nephrol Dial Transplant. 2013;28:2851-9.
- [Google Scholar]
- Ultrasound lung comets: A clinically useful sign of extravascular lung water. J Am Soc Echocardiogr. 2006;19:356-63.
- [Google Scholar]