

Translate this page into:
Evaluation of Iron Status in Patients of Chronic Kidney Disease - A Study to Assess the Best Indicators Including Serum Transferrin Receptor Assay
This is an open access journal, and articles are distributed under the terms of the Creative Commons Attribution-NonCommercial-ShareAlike 4.0 License, which allows others to remix, tweak, and build upon the work non-commercially, as long as appropriate credit is given and the new creations are licensed under the identical terms.
This article was originally published by Wolters Kluwer - Medknow and was migrated to Scientific Scholar after the change of Publisher.
Abstract
Anemia is an early complication of chronic kidney disease (CKD). The iron deficiency is an important contributor, more so in the Indian population. As routine standalone iron tests do not accurately reflect the actual status in the complex environment of CKD, there is a need to study better indicators. Serum iron, ferritin, total iron-binding capacity (TIBC), and serum transferrin receptor (sTfR) levels were estimated in 100 primary iron deficiency anemia (IDA) patients (controls-Group 1) and 68 newly diagnosed CKD cases. The CKD patients were divided into two groups: Serum ferritin <=100 μg/L (Group 2) and >100 μg/L (Group 3). The values of percentage saturation, log of ferritin (log_ferritin), and the ratio of sTfR to log ferritin (sTfR/log_f or sTfR index) were calculated. The CKD cases were further divided depending on ferritin cut-offs of 30, 50, 70, and 100 μg/L and statistically analyzed including ROC and AUC, to choose the best diagnostic parameter for accurate assessment of iron status in CKD cases. The mean serum ferritin was 11.34 μg/L, 28.70 μg/L, and 281.81 μg/L, and the mean sTfR was 2.34 μg/ml, 1.82 μg/ml, and 1.28 μg/ml in Groups 1, 2, and 3. Among all groups, the difference was found to be significant for serum iron, log_ferritin, and sTfR/log_f. The sTfR and sTfR/log_f showed good discrimination between IDA and Anemia of chronic disease in CKD cases, but sTfR/log_f gave the best discrimination at all cut-off levels of ferritin. At a ferritin cut-off of 50 μg/L, the sTfR/log_f value of 0.83 had a sensitivity of 93.5% and specificity of 95.45%, and at a ferritin cut-off 100 μg/L, the same value of 0.83 had a sensitivity of 95.5% and specificity of 86.5%. The ratio of sTfR/log_f is the best indicator for assessing iron status in CKD.
Keywords
Anemia
chronic kidney disease
ferritin
transferrin receptor

Introduction
Anemia is an early complication of chronic kidney disease (CKD) and causes increased morbidity and mortality.[1] Anemia develops from intermediate stages of CKD and worsens with progression of CKD. The cause of anemia is varied and includes nutritional deficiency, increased pro-inflammatory cytokines, chronic blood loss, and relative erythropoietin (EPO) deficiency. This decrease in EPO matches the decline in kidney function and is the main determinant of anemia in CKD stage 4-5.[2] This rationale forms the basis for treating CKD with erythropoiesis stimulating agents (ESA).
Iron deficiency is common in India because of low socio-economic status. In addition, CKD is a major cause of morbidity and co-morbidity in India. Considering the combined effects of both the clinical entities, it becomes very important to establish the relation and effect of each of them on the other. The common causes of iron deficiency in this group of patients are usually a combination of poor nutrition, poor intestinal absorption of dietary iron, chronic inflammation, and chronic blood loss. It is also postulated that iron deficiency and low iron stores are the main causes of hypo-responsiveness to ESA therapy. Thus, the use of iron in combination with ESA is usually required for optimal management of the anemia of CKD.
The effective management of anemia in patients with CKD (especially ESRD) requires close monitoring of iron status and adequate replenishment of iron stores especially during treatment with recombinant erythropoietin (rEPO).[3] Because the effectiveness of rEPO therapy is often dependent on the availability of iron, accurate assessment of the iron status of the patient is crucial.[3] Incorrect assessment of iron status may result in inaccurate management of patients, leading to iron deficiency or overload that can cause unwanted oxidative injury.[4] Hence, the assessment of parameters that accurately reflect iron status is important in achieving good patient care in the setting of CKD. The aim of the study was to evaluate the iron status in newly diagnosed CKD cases, and to determine the most suitable indicator, which would reflect the true iron status in these patients.
Materials and Methods
The study population consisted of all newly diagnosed patients (adults and children >15 years of age) of CKD who were anemic (as per WHO guidelines), reporting to the Nephrology OPD in tertiary health care center over a period of one year. The patients who have not been started on hematinics, dialysis, or ESA were included in the study. We excluded patients of acute kidney injury, concomitant hemolytic anemia, hematological neoplasm, infection, inflammation, or other chronic diseases. We took 100 antenatal care (ANC) females, with iron deficiency anemia (IDA) as a control group representing pure IDA to standardize and validate the tests. The samples in this group were collected at the first visit to the hospital before starting iron supplements.
Two ml of blood was collected in a vial containing di-potassium EDTA for complete blood count. Five ml of blood was collected in sterile iron free plastic containers. Serum was separated and stored in different aliquots at −70°C for further testing of iron related parameters. Fresh peripheral smear was made and stained by Leishman-Giemsa stain as part of routine workup.
Serum iron (iron-ferrozine method), serum ferritin (ELISA assay, Calbiotech, Austin Drive, Spring valley, California, USA), total iron-binding capacity (TIBC), and serum transferrin receptor (sTfR) levels (Human sTfR ELISA, BioVendor Laboratory Medicine, Czech Republic) were estimated on the stored samples. The qualitative estimation of C- reactive protein (CRP) (Tulip diagnostics (P) Ltd, Bambolim Goa, India) was done for all CKD cases. Percentage saturation (per_SAT or TSAT), log of ferritin (log_ferritin), and the ratio of sTfR to log ferritin (sTfR/log_f) were calculated.
We initially divided the individuals into three groups. Group 1 consisted of ANC cases. CKD patients were further divided into two groups with respect to serum ferritin levels. Patients with serum ferritin <100 μg/L were placed in Group 2, and patients with serum ferritin >100 μg/L were placed in Group 3. Good response to intravenous iron therapy at the end of 1 month was considered as evidence of pre-existing/concomitant iron deficiency in the patient.
To establish the most appropriate test for accurate measurement of iron status in CKD patients, sub-analysis of Groups 2 and 3 (combined) was done using different ferritin cut-off levels to classify the groups into iron deficiency and absence of iron deficiency (ferritin level at 100, 70, 50, and 30 μg/L were used). Receiver operating characteristic (ROC) curve and area under curve (AUC) were plotted for TIBC, Per_sat, sTfR, and sTfR/log_f (sTfR index) values at these cut -off values to determine the best fit. CRP was measured as a marker for inflammation for all CKD cases and recorded as positive or negative. The results in this study were analyzed without distinction between male and female patients, as sTfR concentrations do not differ significantly between male and female patients.[5]
The data obtained were statistically analyzed using IBM SPSS Statistics ver. 20.0 (IBM Co., Armonk, NY, USA), and all values were expressed as mean ± SD. All variables were compared for the cases using ANOVA. Post-hoc test was also performed. The t test was also done between Groups 2 and 3. ROC curves were plotted for various indices at different ferritin cut-offs and values calculated.
The study was approved by the institutional ethical committee and written informed consent was obtained from all participants.
Results
We studied 68 cases of CKD and 100 ANC cases with newly diagnosed anemia. Out of 68 CKD cases, 27 were women and 41 were men. These patients were in CKD stage 3-5. The age of the patients ranged from 15 to 79 years. Diabetic nephropathy, hypertension and chronic glomerulonephritis found to contribute 54.4% (37), 27.9% (19) and 13.2% (9) cases respectively. Two patients had lupus nephritis (2.9%). One patient had autosomal dominant polycystic kidney disease (1.5%).
Group 1 comprised 100 ANC cases (59.52%), Group 2 had 27 patients (16.07%), and Group 3 had 41 patients (24.4%). The results of iron status markers for the 168 anemic patients are summarized in Table 1 and Figures 1, 2. In Group 1, mean serum ferritin was 11.34 μg/L (SD 3.88) and sTfR 2.34 μg/ml (SD 0.55). In Group 2, the mean serum ferritin and mean sTfR were 28.70 μg/L (SD 26.59) and 1.82 (μg/ml) (SD 0.68), respectively. All patients in Group 2 had per_SAT less than 20 except one case with 22.2%. In Group 3, the mean serum ferritin was 281.81 μg/L (SD 142.39) and sTfR of 1.28 μg/ml (SD 0.50).
| Iron status markers | Group 1 (100 cases) | Group 2 (27 cases) | Group 3 (41 cases) | |||
|---|---|---|---|---|---|---|
| Mean±Std. Deviation | Range | Mean±Std. Deviation | Range | Mean±Std. Deviation | Range | |
| Hb (gm/dl) | 8.26±0.68 | 4.10 (5.90-10.00) | 9.63±1.62 | 6 (6-12) | 8.98±1.43 | 5.1 (6.2-11.30) |
| S Iron (µg/dl) | 91.74±10.86 | 46 (67-113) | 40.6±16.28 | 58 (16-74) | 53.68±29.62 | 123 (18-141) |
| TIBC (µg/dl) | 416.86±35.47 | 188 (304-492) | 403.14±34.61 | 132 (306-438) | 399.39±27.25 | 114 (324-438) |
| Per_SAT (%) | 22.17±2.28 | 22.3 (13.6-35.9) | 10.34±4.94 | 18.6 (3.6-22.2) | 13.91±8.66 | 37.24 (4.10-41.34) |
| Ferritin (µg/l) | 11.34±3.88 | 16.0 (4.0-20.0) | 28.70±26.59 | 93.02 (2.72-95.73) | 281.81±142.39 | 605.95 (105.8-711.75) |
| Log_ferritin | 1.03±0.155 | 0.7 (0.64-1.34) | 1.29±0.40 | 1.55 (0.43-1.96) | 2.4±0.21 | 0.83 (2.02-2.85) |
| sTfR (µg/ml) | 2.34±0.55 | 3 (1.0-4.0) | 1.82±0.68 | 2.55 (0.45-3.0) | 1.28±0.5 | 1.81 (0.35-2.16) |
| sTfR/log_f | 2.40±0 0.81 | 4.38 (0.9-5.28) | 1.68±1.133 | 5.12 (0.23-5.35) | 0.53±0.21 | 0.83 (0.17-1.00) |
S Iron: Serum iron concentration, TIBC: Total iron binding capacity, per_SAT: Percentage saturation, log_ferritin-log arithmic value of serum ferritin level, sTfR: Serum transferrin levels, and sTfR/log_f: Ratio of sTfR to log ferritin
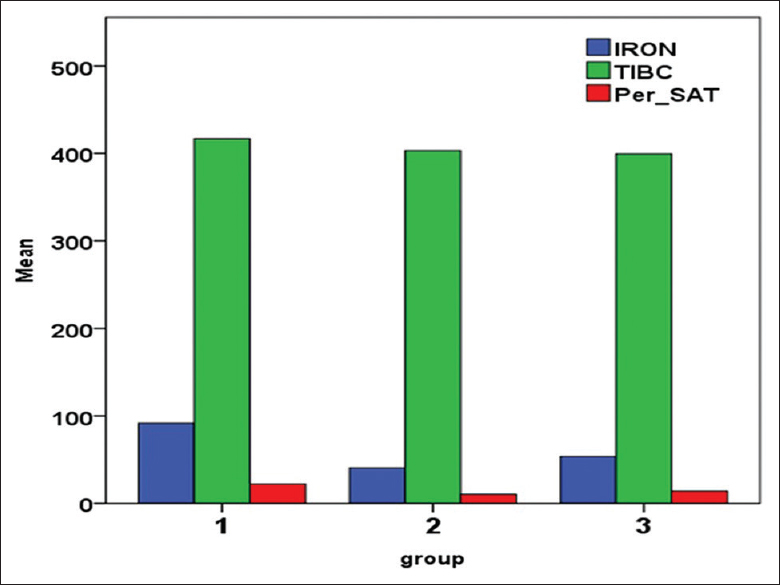
- Mean values of S Iron, TIBC, and Per_SAT in the three groups. S Iron - Serum iron concentration, TIBC - Total iron binding capacity, per_SAT - Percentage saturation

- Mean values of Log of serum ferritin (Log_ s ferritin), sTfR, and ratio of sTfR to log ferritin (sTfR/log_f) in the three groups. Log_ferritin- Logarithmic value of serum ferritin level, Stfr - serum transferrin levels, stfrlog_f - ration of sTFR to log ferritin
On a comparative t test, significant difference was found among Groups 2 and 3 (at ferritin cut-off of 100 μg/L) for serum iron concentration (S iron) (P = 0.006), per_SAT (P = 0.013), ferritin (P = 0.000), log_ferritin (P = 0.000), and sTfR/log_f (sTfR index) (P = 0.000).
ROC curve and AUC in CKD cases were plotted for TIBC, per_SAT, sTfR, and sTfR/log_f (sTfR index) as shown in Figure 3. The single best diagnostic parameter for detecting iron deficiency in patients of CKD by ROC curve analysis was found to be the sTfR/log_f (sTfR index) [Table 2].

Receiver operator curve (ROC) plots for sTfR_f, sTfR, TIBC, and per_SAT values for different ferritin cut-offs in Group 2 and 3 (cases). Log_ferritin- Logarithmic value of serum ferritin level, sTFR - serum transferrin levels, sTFRlog_f - ration of sTFR to log ferritin S Iron - Serum iron concentration, TIBC - Total iron binding capacity, per_SAT - Percentage saturation
| Test | Ferritin_100 | Ferritin _70 | Ferritin_50 | Ferritin_30 |
|---|---|---|---|---|
| sTfR/log_f | 0.918 | 0.961 | 0.974 | 0.960 |
| sTfR | 0.733 | 0.777 | 0.798 | 0.778 |
| TIBC | 0.574 | 0.552 | 0.544 | 0.548 |
| per_SAT | 0.391 | 0.399 | 0.410 | 0.429 |
sTfR/log_f: Ration of sTfR to log ferritin, sTfR: Serum transferrin levels, TIBC: Total iron-binding capacity, and per_SAT: Percentage saturation
The subanalysis of Groups 2 and 3 using different ferritin level cut-off levels (i.e., ferritin level at 100, 70, 50, and 30 μg/L) revealed that sTfR/log_f (sTfR index) gave the best discrimination at all the cut-off levels with the ferritin especially with cut-off value of ferritin at 50 μg/L. [AUC = 0.974 (95% CI 0.933–1.000), P = 0.000, SE 0.21]
At ferritin cut-off at 50 μg/L, the sTfR/log_f value of 0.83 gave a sensitivity of 95.5% and specificity of 93.5%, whereas the same value at ferritin cut-off at 70 μg/L gave a sensitivity of 91.7% and specificity of 95.5%, and at ferritin cut-off 100 μg/L gave a sensitivity of 81.5% and specificity of 95.1%.
The CRP was measured as a marker for inflammation for all CKD cases and recorded as positive or negative. In Group 2, six out of 27 were CRP positive. In Group 3, 23 patients were CRP positive with a mean serum ferritin of 319.95 μg/L, and 18 patients were CRP negative with a mean serum ferritin of 227.96. The differences were not significant.
Discussion
The evaluation of anemia in chronic diseases is not straightforward and this is even more so in CKD, especially in Indian patients in whom IDA is widely prevalent. There is a complex interplay of nutritional deficiency, inflammation, chronic blood loss, and renal failure in causation of anemia in CKD patients.[6] Iron is an essential element for numerous important biologic reactions including oxygen transport, cellular respiration, and DNA synthesis. However, the same property also makes excess iron toxic by generating free radicals, which can damage cells.[4] Systemic and cellular iron levels must therefore be tightly regulated.
The tests which are routinely used for evaluating iron status include serum iron, serum ferritin, TIBC, and per_SAT. The per_SAT corresponds to circulating iron which is calculated using the formula: serum iron divided by TIBC. Serum ferritin measures iron stores. Serum ferritin is the single most commonly used laboratory test to diagnose iron deficiency as its concentration is a surrogate marker for iron stores. However, the most important drawback of measuring serum ferritin is that it is an acute phase protein. As a result, a wide range of reference limits for serum ferritin have been suggested to diagnose iron deficiency in patients with chronic inflammation.[78]
Traditional laboratory indices of iron status such as serum iron, TIBC, and serum ferritin do not always distinguish anemia of chronic disease (ACD) from IDA as both serum ferritin and transferrin can be affected by chronic inflammation. Per_SAT fluctuates widely as a result of diurnal variation in serum iron, and transferrin is also affected by the nutritional status of individual.[69] Per_SAT may decrease in the presence of acute and chronic inflammation, whereas in cases of malnutrition or chronic disease, per_SAT may be high as there is a decrease in transferrin synthesis.[1011] In contrast, sTfR concentration is proportional to the amount of TfR expressed by the cells, increases with increased cellular iron needs, and cellular proliferation, and thus, better reflects erythropoietic activity.[12] In addition to this, sTfR is unaffected by inflammation and rise in sTfR level may be the first detectable response noted after ESA therapy in CKD patients.[10]
sTfR has been shown to be of value in differentiating IDA from ACD, but in the setting of CKD, it is more reflective of erythroid proliferation. However, the test is currently relatively expensive and needs standardization.[6] The sTfR index was found to be more valuable, and thus, best used in combination with other indices.[13]
The gold standard test for assessing iron status is staining the bone marrow with Perl's stain. However, this procedure is invasive, expensive, and painful, and it cannot be used for routine follow-up. Furthermore, the measurement is in the form of a semi-quantitative score and suffers observer bias. Thus, the search for non-invasive and sensitive means for detection of iron deficiency, which is not influenced by acute or chronic inflammatory conditions, especially in CKD patients, is pertinent. Furthermore, as serum ferritin is a measure of the storage iron compartment, and sTfR reflects the functional iron compartment, the sTfR/log_f (sTfR index), may be a better estimate of the actual iron status than either of them alone.[613]
Clinical nephrology guidelines recommend use of serum ferritin and per_SAT measure to guide iron therapy. Serum ferritin less than 100 μg/L and per_SAT less than 20% are taken as a sign of iron deficiency in CKD.[314] Transferrin receptor-ferritin index >0.6, calculated by the ratio of sTfR to ferritin levels, has been recommended for detection of iron deficiency and to predict the response to intravenous iron therapy in dialysis patients.[15] International guidelines recommend an upper limit of serum ferritin at 500 μg/L to avoid potential complications that are associated with iron therapy.[16] A study found that sensitivity of serum ferritin in excluding iron deficiency was 90% at 300 μg/L and 100% at 500 μg/L.[11]
In a study by Chuang et al., only 17% of iron-deficient hemodialysis patients had serum ferritin <300 μg/L.[17] Kalantar-Zadeh et al. in a study (using bone marrow iron as gold standard) found that at the cut-off serum ferritin of 200 μg/L and per_SAT of 20%, the sensitivity was 41% and 88% and specificity was 100% and 63% for serum ferritin and per_SAT respectively.[18] However, it is common to encounter the situation where the per_SAT is low, but ferritin is normal to high. This may be because of reticuloendothelial system block or a functional iron deficiency.[10]
In the present study, serum ferritin levels ranged from 2.72 μg/L to 711.75 μg/L in CKD patients (Group 2 and Group 3 combined). The parameters of log ferritin, sTfR, and ratio of sTfR/log_f (sTfR index) value were good indicators to differentiate IDA and ACD in CKD cases according to established parameters. For diagnosis of iron deficiency in CKD patients not on dialysis or on peritoneal dialysis, the recommended cut-offs for ferritin and per_SAT are 100 μg/L and 20%, respectively.[14] In the present study, data was analyzed at serum ferritin cut-off values of 30, 50, 70, and 100 μg/L, as iron stores normally fall in the lower range in Indian population.
In our study, sTfR index (sTfR/log_f) gave the best discrimination at all ferritin cut-offs and the best AUC at a ferritin value of 50 μg/L [Table 2]. This is similar to results from studies that also suggest that combination and calculated indices may be more accurate at determining iron status than the current standalone parameters.[131920] Although the AUC at different ferritin levels were comparable, a larger study is required to determine if lower cut-offs are required for the Indian population.
At present, no single available test is both practical to administer and accurate in determining iron status.[14] However, newer methods such as percentage of hypochromic red blood cells (% HRC), reticulocyte Hb content (CHr), serum transferrin receptor (sTfR), and hepcidin assay estimation are being evaluated.[610] The various methods used for of hepcidin assay, lack uniformity.[21] Furthermore, the complex relationship of various factors in CKD patients has been found that influence hepcidin levels in these patients. For e.g., iron, inflammation, and reduced renal clearance tend to increase hepcidin, whereas anemia, ESAs, dialysis clearance, and hypoxia tend to reduce hepcidin.[22]
In contrast to other parameters, the sTfR test in the form of an ELISA kit is easily available and does not need special hematology analyzers. However, there needs to be good quality control and proper inter laboratory standardization before it can be recommended for wide spread use. In addition, the high cost of the assay is another deterrent to its uptake, especially in a developing country like India.
Limitations of the study
This was a cross-sectional study design with a one-time measurement of various iron indices
Serum albumin, which is a nutritional status indicator, was not measured. This may affect the interpretation of transferrin levels, which are affected by nutrition
Iron deficiency in this study was defined using serum ferritin, which itself is subject to large biological variability. However, it is the most common and universally accepted method to determine iron status
The cut-off values of serum ferritin at 30, 50, and 70 μg/L for ROC analysis were chosen arbitrarily
Separate statistical analysis depending on sex was not done because of low numbers in the sub groups and was not part of the study design.
Conclusion
In this study, we found that the calculated ratio of sTfR/log_f or sTfR index measurement, at a serum ferritin cut-off value of 50 μg/L gave the best fit with good sensitivity and specificity. Both the ferritin and sTfR measurements are ELISA based tests that are easy to perform in a standard laboratory. However, larger studies are required to determine and validate appropriate cut-off values for diagnosis of IDA in the Indian population.
Financial support and sponsorship
Nil.
Conflicts of interest
There are no conflicts of interest.
References
- Timing of onset of CKD- related metabolic complications. J Am Soc Nephrol. 2009;20:164-71.
- [Google Scholar]
- Timing and determinants of erythropoietin deficiency in chronic kidney disease. Clin J Am Soc Nephrol. 2012;7:35-42.
- [Google Scholar]
- National Institute for Health and Care Excellence (NICE) 2015. Chronic Kidney Disease: Managing Anaemia. NICE Guideline. Available from: https://www.nice.org.uk/guidance/ng8/chapter/1-Recommendations
- [Google Scholar]
- Iron metabolism, free radicals, and oxidative injury. Biomed Pharmacother. 2001;55:333-9.
- [Google Scholar]
- Measurement of soluble transferrin receptor in serum of healthy adults. Clin Chem. 1998;44:35-9.
- [Google Scholar]
- Iron deficiency anaemia is associated with high concentration of transferring receptor in serum. Clin Chem. 1994;40:774-6.
- [Google Scholar]
- Measurement of serum ferritin used to predict concentrations of iron in bone marrow in anaemia of chronic disease. Clin Chem. 1991;37:560-3.
- [Google Scholar]
- Analytical and biological variation in measures of anemia and iron status in patients treated with maintenance hemodialysis. Am J Kidney Dis. 2010;56:540-6.
- [Google Scholar]
- Assessing iron status: Beyond serum ferritin and transferrin saturation. Clin J Am Soc Nephrol. 2006;1(Suppl 1):S4-8.
- [Google Scholar]
- The evaluation of iron status in hemodialysis patients. J Am Soc Nephrol. 1996;7:2654-7.
- [Google Scholar]
- Serum soluble transferrin receptor concentration is an accurate estimate of the mass of tissue receptors. Exp Hematol. 2001;29:677-85.
- [Google Scholar]
- Improved differential diagnosis of anaemia of chronic disease and iron deficiency anaemia: A prospective multicenter evaluation of soluble transferrin receptor and the sTfR/log ferritin index. Am J Hematol. 2011;86:923-7.
- [Google Scholar]
- KDIGO Clinical Practice Guideline for Anaemia in Chronic Kidney Disease. Kidney Int Suppl. 2012;2:279-335.
- [Google Scholar]
- Association between transferrin receptor-ferritin index and conventional measures of iron responsiveness in hemodialysis patients. Am J Kidney Dis. 2006;47:1036-44.
- [Google Scholar]
- Revised European best practice guidelines for the management of anaemia in patients with chronic renal failure. Nephrol Dial Transplant. 2004;19:1-47.
- [Google Scholar]
- Early prediction of response to intravenous iron supplementation by reticulocyte haemoglobin content and high-fluorescence reticulocyte count in haemodialysis patients. Nephrol Dial Transplant. 2003;18:370-7.
- [Google Scholar]
- Diagnosis of iron deficiency anaemia in renal failure patients during the post-erythropoietin era. Am J Kidney Dis. 1995;26:292-9.
- [Google Scholar]
- Soluble Transferrin Receptor (sTfR), Ferritin, and sTfR/Log Ferritin Index in anemic patients with nonhematologic malignancy and chronic inflammation. Clin Chem. 2002;48:1118-21.
- [Google Scholar]
- Guideline for the laboratory diagnosis of functional iron deficiency. Br J Haematol. 2013;161:639-48.
- [Google Scholar]
- Results of the first international round robin for the quantification of urinary and plasma hepcidin assays: Need for standardization. Haematologica. 2009;94:1748-52.
- [Google Scholar]
- Molecular mechanisms of hepcidin regulation: Implications for the anaemia of CKD. Am J Kidney Dis. 2010;55:726-41.
- [Google Scholar]