

Translate this page into:
Effects of Individualized Dialysate Sodium Prescription in Hemodialysis – Results from a Prospective Interventional Trial
-
Received: ,
Accepted: ,
This is an open access journal, and articles are distributed under the terms of the Creative Commons Attribution-NonCommercial-ShareAlike 4.0 License, which allows others to remix, tweak, and build upon the work non-commercially, as long as appropriate credit is given and the new creations are licensed under the identical terms.
This article was originally published by Wolters Kluwer - Medknow and was migrated to Scientific Scholar after the change of Publisher.
Abstract
Introduction:
Individualized dialysate sodium prescription does affect weight gain, blood pressure (BP), and intradialytic complications. A prospective interventional trial (Dialysate Individualised Sodium (DISO) trial) was conducted to study this issue in Indian patients.
Methods:
Forty patients on thrice-weekly maintenance hemodialysis (HD) for at least 6 weeks were enrolled. The study was performed in two different phases. In the first phase, 12 consecutive HD sessions were done with a standard dialysate sodium concentration of 140 mEq/L. In the second phase, 12 consecutive HD sessions were done with dialysate sodium concentration set to individualized value (mean of pre-HD sodium concentration multiplied by Donnan coefficient of 0.95). Differences in pre- and post-HD sodium, interdialytic weight gain (IDWG), pre- and post-HD BP, thirst scores, and intradialytic adverse events during both phases were assessed.
Results:
The mean age of patients was 45.65 years (24 males, 16 females). The mean serum pre-HD sodium level was 138.7 ± 1.7 meq/L in the standard phase and 138.2 ± 2.6meq/L in the individualized phase (P = 0.229). In the standard phase, the mean IDWG was 2.64 ± 1.56 kg and 2.13 ± 0.99 kg in the individualized phase (P = 0.008). The mean pre-HD systolic BP was 138 ± 18 mmHg and 134 ± 17 mmHg in the standard and individualized phases (P = 0.008). There was no difference in intradialytic symptoms, hypotensive episodes or requirement of interventions. Hypertension episodes occurred at a mean value of 2.2 and 1.2 in the standard and individualized phases, respectively (P = 0.010).
Conclusion:
The use of individualized dialysate sodium level is safe and results in lower IDWG, pre-HD systolic BP, and intradialytic hypertension in patients on HD.
Keywords
Dialysate sodium
hemodialysis
individualized sodium
sodium set point

Introduction
Sodium is the major extracellular cation in the body, and hence is the major determinant of extracellular fluid (ECF) content and serum osmolarity.[1] Volume overload is a major problem in patients on hemodialysis (HD) and is mainly contributed by sodium overload. Sodium entry occurs in HD patients from dietary intake, from dialysis fluid during each HD session, or from saline infusions given during HD. Currently, all patients undergoing maintenance HD in our center and many centers worldwide are dialysed with dialysate sodium of 140 meq/L. This dialysate sodium level is used in all patients irrespective of their blood sodium values. It is known that dialysis patients have an individualized sodium and osmolarity value, which are known as sodium and osmolar set points, respectively, which are unique for each patient and is highly conserved.[234] A higher dialysate sodium concentration more than the patient's plasma sodium level will cause sodium gain during dialysis and increase the total body sodium. This can promote interdialytic fluid ingestion to restore an individual's sodium and osmolar set point. These patients might be actually having a lower sodium set point and if so, with each HD session, more sodium is being added to their body, contributing to increased thirst, interdialytic weight gain (IDWG) and blood pressure (BP). Long-standing fluid overload can lead to uncontrolled hypertension, left ventricular hypertrophy (LVH), and thus lead to cardiovascular morbidity and mortality. Theoretically, it looks advantageous to use tailor-made sodium dialysate to avoid addition of excess sodium to the body during HD sessions. Several studies have been done around the world regarding the utility of individualizing sodium prescription in HD patients, but the results have been inconsistent. There are hardly any studies from India and Asia in this regard. Our objective was to study whether individualization of dialysate sodium concentration will improve IDWG, BP, fluid overload, and HD-related symptoms.
Materials and Methods
The trial was a prospective intervention trial approved by the institutional review board of Christian Medical College, Vellore, and registered with Clinical Trial Registry of the Government of India (CTRI reg no. 2017/12/010735). A sample size of 40 was calculated based on the reference study by De Paula et al.,[5] to detect a difference of 0.48 kg weight between the two phases with 80% power and 5% level of significance and assuming a dropout rate of 10%.
Consented patients who were above 18 years of age and were on thrice-weekly maintenance HD for at least 6 weeks were enrolled in the study. The exclusion criteria were as follows: (1) expected life expectancy less than 6 months, (2) pre-HD sodium less than 130 meq/L or >140 meq/L at recruitment, (3) considered by the treating nephrologist to have concomitant illnesses or conditions that limit or contraindicate study procedures and follow-up [e.g., frequent intradialytic hypotension (IDH) requiring fluid resuscitation], (4) documented infiltrative cardiomyopathies (amyloidosis, glycogen storage disease), hereditary cardiomyopathies (hypertrophic cardiomyopathy), or moderate to severe aortic valve disease (aortic stenosis, regurgitation), and (5) amputees.
The study was performed in two different phases, with each subject used as his or her own control. In the first phase, patients were submitted to 12 consecutive HD sessions with a standard dialysate sodium concentration fixed at 140 mEq/L, which is the standard concentration used in our dialysis facility. The pre- and post-HD plasma sodium concentration was determined for each patient in four different midweek dialysis sessions and their mean was calculated. In the second phase of the study, patients were subjected again to 12 consecutive HD sessions, but the dialysate Na+ concentration was set to individualized value (mean of pre-HD Na+ concentration multiplied by Donnan coefficient of 0.95). Donnan coefficient is a correction factor applied to get the dialysate sodium value, which will result in eunatremic dialysis. Gibbs–Donnan effect in HD occurs due to nondiffusable, negatively charged plasma proteins creating an electric field that attracts sodium, thus reducing the diffusion of sodium from plasma across the dialysis membrane.[6]
Patients were not aware of dialysate sodium prescription. The primary outcome was average IDWG (pre-HD weight minus post-HD weight from the previous session). The secondary outcomes were thirst score (TS) (assessed by categorical scale), BP (pre- and postdialysis, systolic, and diastolic), IDWG percentage, HD-related symptoms including cramps, nausea, vomiting (recorded by the nursing staff), IDH, requirement of interventions during HD (including normal saline administration, placement in Trendelenburg or supine position, and Ultrafiltration (UF) reduction or discontinuation), and intradialytic hypertension.
Data were assessed by data safety and monitoring board (DSMB) midway and at the end of the study. The detailed study algorithm is given in Figure 1.
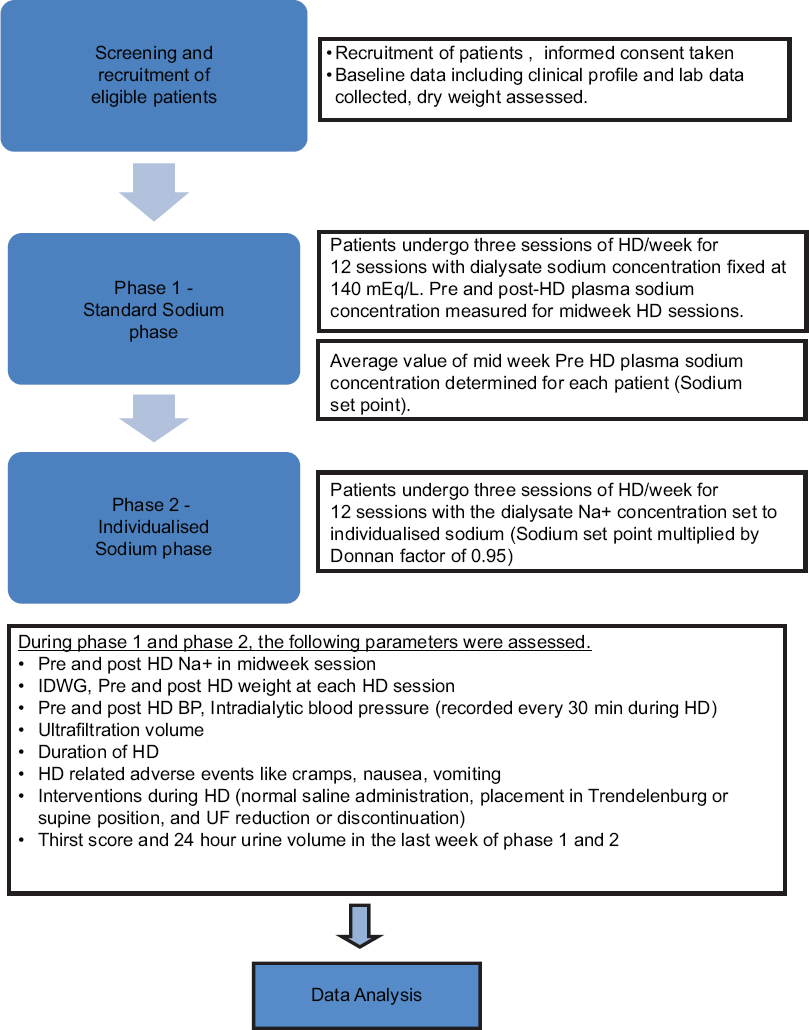
- Detailed diagrammatic algorithm of the study
Definitions used in the study
IDWG – pre-HD weight minus post-HD weight from the previous session
IDWG% – IDWG × 100/dry weight
Intradialytic hypotension (IDH) – defined as the difference in pre-HD SBP and lowest intradialytic SBP >30 mmHg or difference between any two intradialytic SBP >30 mmHg
Intradialytic hypertension – defined as rise in SBP >10 mmHg during or just after dialysis
Thirst score (TS) – TS was assessed in the last week of phases 1 and 2 using a categorical scale given in Figure 2.
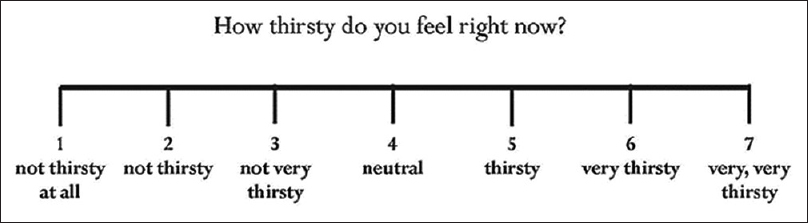
- Categorical scale for Thirst score
Statistical methods
The data were summarized as counts and percentages for categorical variables, and mean and standard deviation or median and range for numerical variables. Paired t-test was used to detect the change in IDWG, IDWG%, BP, TS, pre-HD, and post-HD sodium levels between standard sodium and individualized sodium phases. Wilcoxon signed-rank test was used to test the difference in IDH, intradialytic complications, and need for intradialytic interventions between the two phases.
Results
Forty patients who met the inclusion criteria were enrolled in this trial. There were 24 males and 16 females with a mean age of 45.65 years (range: 19–72 years). Native kidney disease was as follows: unknown (17 patients, 42.5%), diabetic nephropathy (10, 25%), chronic glomerulonephritis (4, 10%), hypertensive nephropathy (3, 7.5%), nephrolithiasis (2, 5%) and chronic pyelonephritis, autosomal dominant polycystic kidney disease, reflux nephropathy and rapidly progressive renal failure (1, 2.5% each). Thirteen patients (32%) had diabetes mellitus and 36 (90%) had hypertension. Seven patients (17%) had history of ischemic heart disease. Thirty-two patients completed both phases of the study, whereas eight patients completed only phase 1. Five patients underwent kidney transplantation, two were changed to twice-weekly dialysis schedule on patients' request and one withdrew consent after phase 1. Only patients who completed phases 1 and 2 were included in the analysis of paired data. Baseline characteristics are shown in Table 1 and the outcomes are summarized in Table 2.
| Characteristic | Mean±SD (range) |
|---|---|
| Age (years) | 45.65±15.48 (19-72) |
| Dialysis vintage (months) | 18.75±20.88 (0.82-79.04) |
| Height (cm) | 159.75±9.76 (139-178) |
| Dry weight (kg) | 54.77±15.59 (35.5-109) |
| Urine output (ml/day) | 304±415 (0-2400) |
| No. of antihypertensives | 1.7±1.2 (0-4) |
| Hemoglobin (g%) | 11.5±2.1 (11.5-17) |
| Serum urea (mg/dL) | 98.8±42.0 (22-237) |
| Serum creatinine (mg/dL) | 10.25±4.23 (2.31-24.00) |
| Serum albumin (g/dL) | 4.0±0.8 (2.8-7.5) |
| Serum potassium (meq/L) | 4.8±0.9 (3.1-6.9) |
| Serum bicarbonate (meq/L) | 19.5±3.9 (10.9-28.5) |
| LV ejection fraction (%) | 52.5±10.4 (20.5-66.0) |
SD: Standard deviation; LV: Left ventricular
| Outcome | Standard sodium phase | Individualized sodium phase | P |
|---|---|---|---|
| Interdialytic weight gain (mean±SD, kg) | 2.63±0.99 | 2.52±1.53 | 0.422 |
| IDWG% (mean±SD) | 5.08±2.30 | 4.92±3.82 | 0.637 |
| Pre-HD systolic BP (mean±SD, mmHg) | 138±18 | 134±17 | 0.008 |
| Pre-HD diastolic BP (mean±SD, mmHg) | 81±5 | 80±6 | 0.215 |
| Post-HD systolic BP (mean±SD, mmHg) | 135±19 | 131±19 | 0.064 |
| Post-HD diastolic BP (mean±SD, mmHg) | 80±7 | 79±6 | 0.155 |
| HD adverse events (mean) | 4.2 | 2.9 | <0.001 |
| HD symptoms (mean) | 0.6 | 0.5 | 0.580 |
| HD interventions (mean) | 1.2 | 1.4 | 0.481 |
| Intradialytic hypotension episodes (mean) | 2 | 2 | 0.933 |
| Intradialytic hypertension episodes (mean) | 2.2 | 1.2 | 0.006 |
| Thirst score | 5.5 | 4.1 | <0.001 |
SD: Standard deviation; IDWG: Interdialytic weight gain; HD: Hemodialysis
Serum sodium levels
The mean pre-HD serum sodium level in the standard phase was 138.7 ± 1.7 meq/L (range: 136–142 meq/L). The mean dialysate sodium level, which was set during individualized sodium HD sessions was 132 meq/L (range: 130–136 meq/L). When only patients who completed both phases were considered, the mean pre-HD serum sodium level in the standard and individualized phases was 138.7 ± 1.7 and 138.2 ± 2.6 meq/L, respectively (P = 0.229). The post-HD serum sodium levels in the two groups were 138.6 ± 5.9 and 136.5 ± 1.7 meq/L (P = 0.075).
Interdialytic weight gain
IDWG was significantly lower in the individualized sodium phase compared with the standard phase. In the standard phase, the mean IDWG was 2.64 ± 1.56 kg, and in individualized sodium phase, it was 2.13 ± 0.99 kg (P = 0.008). The mean IDWG% was 5.09 ± 2.30 and 3.97 ± 1.20 in the standard and individualized phases, respectively (P = 0.015).
Blood pressure
The mean predialysis systolic BP was significantly lower in the individualized phase (138 ± 18 and 134 ± 17 mmHg in the standard and individualized phases, respectively, P = 0.008). The mean predialysis diastolic BP was 81 ± 5 and 80 ± 6 mmHg in the two phases, respectively (P = 0.215). The mean post-HD systolic BP was 135 ± 19 and 131 ± 19 mmHg, respectively (P = 0.064) and post-HD diastolic BP 80 ± 7 and 79 ± 6 mmHg, respectively, in the two phases (P = 0.155).
Intradialytic symptoms, adverse events, interventions, hypotension, and hypertension
The mean number of adverse events was 4.2 per subject (intradialytic symptoms or hypotension or hypertension) in the standard phase and 2.9 per subject in the individualized phase (P< 0.001). The mean symptomatic episodes were 0.6 per subject in the standard phase and 0.5 per subject in the individualized phase (P = 0.580). The mean episodes requiring intervention (placement in Trendelenberg position, normal saline infusion, or reduction/stoppage of UF) were 1.2 per subject in the standard phase and 1.4 per subject in the individualized phase (P = 0.481). There were a mean hypotensive episodes of two per subject in both the standard and individualized phases (P = 0.933). Intradialytic hypertension episodes occurred at a mean value of 2.2 per subject in the standard phase and 1.2 per subject in the individualized phase (P = 0.006).
Change in antihypertensive drug requirement
Of the 32 patients who completed both phases of the study, antihypertensive drugs could be stopped in 3 patients (9.4%). The number of drugs could be reduced in another three patients (9.4%) during individualized phase. Twenty-six patients (81.2%) were continued on the same drugs during phase 2.
Thirst score
TS was assessed by a categorical scale. There was a significant decrease in the TS in individualized phase (TS 4.1) compared to standard phase (TS 5.5) (P< 0.001).
Discussion
Even in uremic patients, sodium is the predominant determinant of serum osmolarity and thus determines intracellular–intravascular fluid distribution, cell volumes, thirst, and BP.[1] HD patients have a constant, individualized, and highly conserved predialysis plasma sodium concentration.[234] Addition of extra sodium to the body will increase the thirst, and thus fluid intake so as to maintain the sodium and osmolar set points, and this in turn leads to excess weight gain, increased ECF volumes, and higher BPs.[1] Flanigan showed that over a 1-year period, dialysis patients have a relatively constant sodium set point, which varied from 132 to 144 meq/L in different patients, and when these patients are dialysed with 140 meq/L sodium dialysate, their predialysis to postdialysis sodium increased by 2.3–3.6 mEq/L.[6] The most common cause of death in dialysis patients is cardiovascular cause, mostly due to lethal arrhythmia, and the key condition associated with this is LVH.[789] LVH leads to activation of myocardial fibrosis pathways, which in turn leads to stiffened myocardium prone to dilated cardiomyopathy and aberrant conduction. Some studies have shown that regression in left ventricular mass occurs with improvements in BP control and ECF volume.[1011] Hence, adjusting the dialysate sodium is a potential measure to reduce fluid overload in HD subjects and thus combat the dangers of LVH.
In our study, the patients had a mean pre-HD sodium level of 138.7 ± 1.7 meq/L in the standard phase. There was no difference in the pre-HD sodium level even when they were dialysed with individualized dialysate sodium concentration. The observation that the mean pre-HD sodium is similar concurs with the concept of a fixed sodium set point in dialysis patients. There was a 2 meq/L difference in the post-HD sodium levels in standard and individualized phases, but it was not statistically significant (138.6 ± 5.9 and 136.5 ± 1.7 meq/L, respectively, P = 0.075). In addition, some patients in the standard phase had a relatively larger rise in post-HD sodium levels, which was not observed during the individualized phase.
Several studies have shown that dialysate sodium prescriptions individualized to each patient's sodium set point can be beneficial but in differing aspects. De Paula et al. prospectively studied 27 HD patients and found that there was decrease in IDWG, interdialytic TSs, and episodes of IDH in the individualized sodium phase compared with the standard phase.[5] In an observational study with a facility level decrease in dialysate sodium from 141 to 138 mmol/L, Thein et al. found no difference in IDWG but decrease in pre- and postdialysis systolic and diastolic BP and predialysis plasma sodium.[12] Aramreddy et al. reported on a case series of 13 patients undergoing thrice-weekly HD with an individualized dialysate sodium prescription in whom dialysate sodium concentration was 2 meq/L lower than the average plasma sodium over the preceding 3 months. They found that individualized reduction in dialysate sodium reduces IDWG without significantly increasing the frequency of cramps or hypotension.[13] Similar results have been obtained by Elshahawy et al. who studied 40 stable chronic HD patients in a single-blind crossover design. Individualized dialysate Na+ concentration was associated with a decrease in IDWG and dialysis hypotension and related symptoms and better BP control in stable chronic HD patients.[14]
In the DISO trial, we observed significant reduction in IDWG during individualized sodium phase. The TS was also significantly lower in the individualized phase. Another significant change observed was in the systolic BP. Both pre- and post-HD systolic BPs were significantly lower by a mean value of 4 mmHg during the individualized phase compared with the standard phase. There was no difference in diastolic BP. There was a statistically significant reduction in the number of intradialytic hypertension episodes when patients received individualized sodium dialysis. There was no increase in hypotension, intradialytic symptoms such as cramps, or requirement of interventions during the individualized phase in spite of the low sodium concentrations used during dialysis. In addition, there was a decrease in the requirement of antihypertensive drugs during individualized sodium dialysis in 19% of patients.
Conclusion
Individualizing dialysate sodium in HD patients significantly decreases inter-dialysis weight gain, pre- and post-HD systolic BPs and intradialytic hypertension episodes. There were no major adverse events during the individualized sodium phase.
Financial support and sponsorship
The study was funded by Fluid Research Fund of the Christian Medical College, Vellore.
Conflicts of interest
There are no conflicts of interest.
References
- Long-term stability of serum sodium in hemodialysis patients. Blood Purif. 2010;29:264-7.
- [Google Scholar]
- Sodium setpoint and gradient in bicarbonate hemodialysis. J Nephrol. 2013;26:1136-42.
- [Google Scholar]
- The association of the sodium “setpoint” to interdialytic weight gain and blood pressure in hemodialysis patients. Int J Artif Organs. 2007;30:971-9.
- [Google Scholar]
- Clinical consequences of an individualized dialysate sodium prescription in hemodialysis patients. Kidney Int. 2004;66:1232-8.
- [Google Scholar]
- How should dialysis fluid be individualized for the chronic hemodialysis patient? Sodium. Semin Dial. 2008;21:226-9.
- [Google Scholar]
- Left ventricular mass in chronic kidney disease and ESRD. Clin J Am Soc Nephrol. 2009;4(Suppl 1):S79-91.
- [Google Scholar]
- Effect of atorvastatin on inflammation and outcome in patients with type 2 diabetes mellitus on hemodialysis. Kidney Int. 2008;74:1461-7.
- [Google Scholar]
- Left ventricular hypertrophy in renal disease: Beyond preload and afterload. Kidney Int. 2009;75:771-3.
- [Google Scholar]
- Effect of frequent nocturnal hemodialysis vs conventional hemodialysis on left ventricular mass and quality of life: A randomized controlled trial. JAMA. 2007;298:1291-9.
- [Google Scholar]
- Serial change in echocardiographic parameters and cardiac failure in end-stage renal disease. J Am Soc Nephrol JASN. 2000;11:912-6.
- [Google Scholar]
- Associations of a facility level decrease in dialysate sodium concentration with blood pressure and interdialytic weight gain. Nephrol Dial Transplant. 2007;22:2630-9.
- [Google Scholar]
- Individualized reduction in dialysate sodium in conventional in-center hemodialysis: Dialysate sodium in conventional HD. Hemodial Int. 2012;16:473-80.
- [Google Scholar]
- Outcome of individualized dialysate sodium concentration for hemodialysis patients. Saudi J Kidney Dis Transplant. 2013;24:507-13.
- [Google Scholar]