

Translate this page into:
Serum C-reactive protein and leptin for assessment of nutritional status in patients on maintenance hemodialysis
This is an open-access article distributed under the terms of the Creative Commons Attribution-Noncommercial-Share Alike 3.0 Unported, which permits unrestricted use, distribution, and reproduction in any medium, provided the original work is properly cited.
This article was originally published by Medknow Publications & Media Pvt Ltd and was migrated to Scientific Scholar after the change of Publisher.
Abstract
Nutrition is one of the key parameters in predicting morbidity and mortality in patients with end-stage renal disease (ESRD) on hemodialysis. Body weight, body mass index, and visceral protein levels (serum protein, albumin, prealbumin, and transferrin) have traditionally been used as markers for nutritional status. Serum leptin and C-reactive protein (CRP), have been recently added to the list of markers for nutritional status. This study was a comparative assessment of serum leptin and CRP for nutritional status in patients with ESRD on maintenance hemodialysis. A total of 40 patients with ESRD on maintenance hemodialysis and a similar number of age-, gender-, and BMI-matched healthy individuals were studies. Complete medical history was obtained and relevant clinical examination including anthropometry was carried out. All the individuals were subjected to routine investigations and special investigations (serum leptin and CRP). Data were analyzed using Student's t-test and correlation was found using Pearson's correlation coefficient. Mean value of serum leptin for the study group (1.44 ± 0.72 ng/ml) was found to be significantly higher than that of the control group (0.68 ± 0.55 ng/ml). In addition, we also observed a positive correlation between serum leptin and BMI (r = 0.350, P<0.05). For CRP, we observed that the study group (3.93 ± 1.20 mg/ml) had a significantly higher value vis-à-vis the control group (0.28 ± 0.24 mg/ml). However, CRP and BMI did not show a significant correlation. Based on the above observations, we conclude that serum leptin is a better biomarker than CRP for assessing nutritional status in patients with ESRD on maintenance hemodialysis.
Keywords
Body mass index
C-reactive protein
hemodialysis
malnutrition
serum leptin

Introduction
End-stage renal disease (ESRD) is a major healthcare problem worldwide, especially in developing countries. According to centers for disease control and prevention (CDC), more than 10%, or more than 20 million, people aged 20 years and older in the USA have chronic kidney diseases (CKD).[1]
In India, due to the absence of national registry, data regarding ESRD are not documented. A recent Indian study[2] has shown that the burden of incident ESRD in India continues to be substantial and is going to be a major health problem. Moreover, due to the economic constraints, less than 10% of the patients receive definite renal replacement therapy.[3]
Malnutrition, which is multifactorial in origin, is one of the major hurdles (18-75%), contributing to mortality of dialysis patients. Restricted diet, metabolic acidosis, gastroparesis, appetite suppression as a side effect of the drugs, chronic volume overload, presence of acute or chronic systemic diseases that cause inflammatory responses, and dialysis itself contribute to malnutrition in these patients.[4] Thus, it is recommended to initiate dialysis before malnutrition sets in.
Serum leptin is increased in CKD and may be responsible for the anorexia–malnutrition syndrome.[56] However, other studies show that malnutrition in renal failure may be due to chronic inflammatory process reflected by increase in CRP.[7]
Leptin (Greek word “Leptos” means thin) is a 16-kD protein found by Zhang et al. It is the product of obese (ob) gene secreted primarily from adipocytes.[5] Its gene is located on chromosome seven and acts via JAK–STAT mechanism. The short half-life of leptin (25 min) requires that it be rapidly cleared from blood either via degradation in peripheral tissues or via filtration across the glomerular basement membrane. Kidney exhibits leptin receptor and 80% of leptin is cleared from it.[6] Studies available in the literature show controversial results for the role of serum leptin in malnutrition, and very few studies are available in Indian population to explore such relationship.
CRP is a member of the class of acute-phase reactants, as its levels rise dramatically during inflammatory processes occurring in the body. This increment is due to a rise in the plasma concentration of IL-6, which is produced predominantly by macrophage as well as adipocytes.[7] Inflammation (increase in CRP) is also one of the contributory factors for malnutrition.[5]
Due to paucity of studies that demonstrate the effect of serum leptin and CRP on body mass index (BMI) in patients with ESRD on hemodialysis in India, this study was planned with the aim of reviewing the association of BMI with serum leptin and CRP levels in ESRD patients, and comparing the effectiveness of using serum leptin as a biomarker vis-à-vis CRP to predict nutritional status. Study results were compared with those of age-, gender-, and BMI-matched (control) Indian population.
Materials and Methods
We conducted the study on eighty subjects over a period of 24 weeks. These subjects comprised men and women aged 20-70 years. The study group comprised 40 patients with ESRD on maintenance hemodialysis for more than 3 months at Lok Nayak Hospital. Patients suffering from any acute infection, acute renal failure, or any endocrine disorder except diabetes mellitus, and those who were taking glucocorticoids 8 weeks prior to or during the study were excluded from our study. The control group consisted of 40 healthy hospital staff members of both genders; Routine hematologic investigations such as hemogram, kidney function tests, and lipid profile were carried out in the control group and found to be within normal limits. These individuals were of matched age group and BMI with the study group.
Study design
Ours was a case-control (case-base type) study. The subjects were selected randomly and informed consent was obtained for them. Institutional Ethical Committee granted the permission to conduct this study.
Complete medical history was obtained, and relevant clinical examination including the following anthropometric tests was performed:
-
Standing height with bare feet was measured accurately to nearest 0.5 cm.
-
Body weight was recorded with an “Avery” weighing scale accurately to within 50 g.
-
Body surface area (BSA) in square meter (m2) was calculated from the height and weight using “Dubois” formula.[8]
BSA (m2) = Wt (kg)0.425 × Ht (cm)0.725 × 0.007184
-
Lean body mass (LBM)/body fat estimation is the difference between total body mass (weight in kg) and weight of the body fat. It can be derived from the following formula:[9]
Lean Body Weight (men) = (1.10 × Weight (kg)) – 128 × (Weight2/(100 × Height (m))2)
Lean Body Weight (women) = (1.07 × Weight (kg)) – 148 × (Weight2/(100 × Height (m))2)
-
BMI in kg/m2 was calculated from total body mass (M, i.e., weight in kilograms) and height (H in meters) using the formula BMI (kg/m2) = M/(H × H). BMI is a reliable indicator for estimation of body fat, wherein a high BMI value usually indicates high levels of body fat and vice versa.[10]
Routine hematologic investigation (hemogram, blood sugar, urea, and lipid profile) and special investigations (serum leptin and CRP) were carried out. DRG leptin ELISA kit, which is a solid-phase enzyme-linked immunosorbent assay based on sandwich principle, was used for the quantitative determination of leptin levels in serum. Erba diagnostic kit was used for the quantitative determination of CRP. It is based on the principle of measurement of antigen-antibody reaction by end-point method using turbidimetric immunoassay.
Statistical analysis
Student's t-test was used for analysis and P > 0.05 was considered as significant. Correlation between the different parameters was found using Pearson's correlation coefficient.
Results
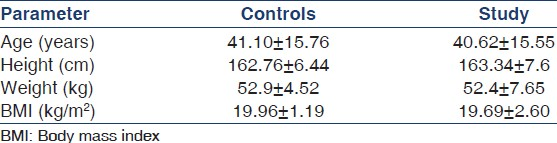
The study and control groups were similar in terms of anthropometric parameters such as age, height, weight, and BMI [Table 1].
On comparing the biochemical parameters across the study and control groups [Table 2], we observed the following:
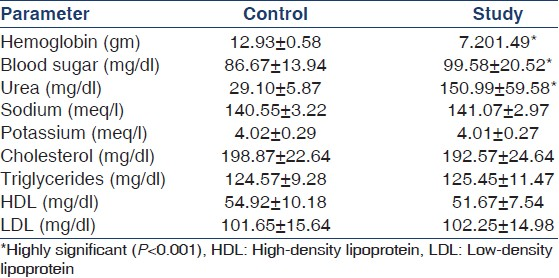
-
Serum electrolytes (sodium and potassium) and lipid profile [cholesterol, triglycerides, High-density lipoprotein (HDL), and low-density lipoprotein (LDL)] were similar across the two groups.
-
Hemoglobin levels were significantly lower in the study group.
-
Blood sugar and kidney function test (urea) levels were observed to be significantly higher in the study group.
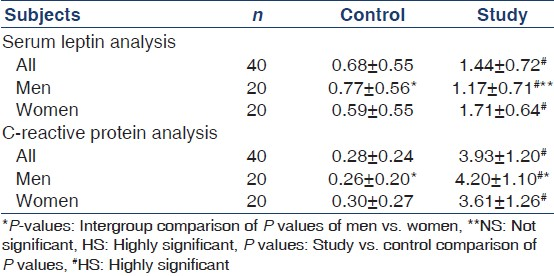
Special investigations were conducted to measure serum leptin and CRP levels in the study and control groups [Table 3].
-
Serum leptin levels were significantly higher in the study group (1.44 ± 0.72 ng/ml) compared to that in the control group (0.68 ± 0.55 ng/ml). Similar observation holds true when we analyze the serum leptin levels in male and female patients separately. The difference in the study and control groups was significant at P < 0.001, i.e., highly significant.
-
CRP levels were also higher in the study group (3.93 ± 1.20 mg/ml) compared to that in the control group (0.28 ± 0.24 mg/ml). Similar observation holds true when we analyze the CRP levels in male and female patients separately. The difference in the study and control groups was significant at P < 0.001, i.e., highly significant.
On further analyzing the correlation of serum leptin and CRP with BMI in the study group [Figure 1], we observed the following:
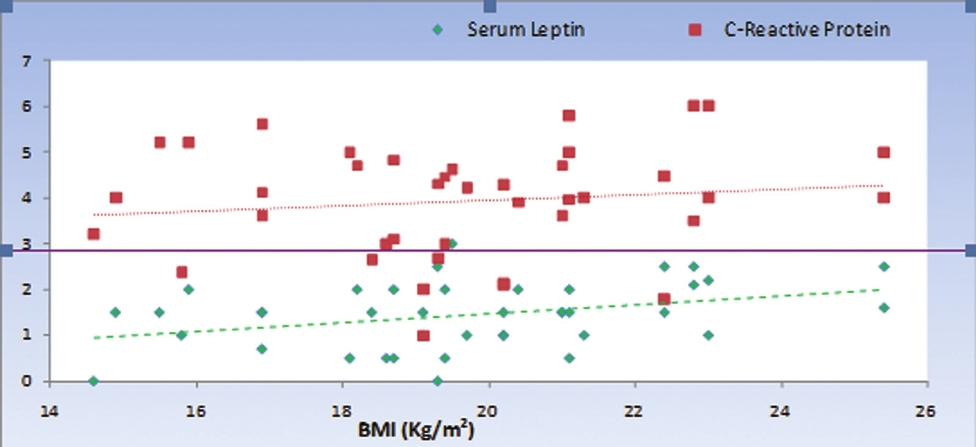
- Correlation of serum leptin and C-reactive protein with body mass index
-
Serum leptin and BMI have a statistically significant positive correlation (r = 0.314), with a P value of 0.048.
-
CRP and BMI did not show any significant correlation (r = 0.126) with a P value of 0.438.
The above results indicate that serum leptin might be a better biomarker than CRP for predicting nutritional status in ESRD patients on maintenance hemodialysis.
Discussion
This study was an effort to find the association of body weight with serum leptin levels and CRP in patients with chronic renal failure on hemodialysis. This study comprised 80 subjects, i.e., reasonably good subjects of either gender spread over a wide age range (20-70 years), thus justifying a better exploration of the correlation between serum leptin and BMI in ESRD patients on hemodialysis in Indian population.
In the complex chronic renal failure syndrome, malnutrition deserves particular attention. The markers of malnutrition were strongly associated with poor quality of life.[11] Although many causes of malnutrition have been mentioned in the literature, one of the most talked about causes is the increase in serum leptin levels.[12] Zhangy et al. reported that hormone leptin increases in CKD and may be responsible for the anorexia – malnutrition syndrome.[13]
Serum leptin levels in this study were significantly higher in patients with CKD on maintenance hemodialysis than that in controls (P < 0.001). This may be because kidney is responsible for about 80% of leptin clearance in healthy individuals. It is cleared from the circulation by the process of glomerular filtration followed by metabolic degradation in renal tubules.[14] In patients with normal renal function, there is a net renal intake of 12% of circulating leptin, whereas in patients with CKD there is no renal uptake of leptin.[15] Consequently, plasma leptin concentrations increased in patients with advanced renal failure undergoing dialysis. These findings are in close agreement with those reported by many Indian as well as Western work.[5613]
BMI is a simple, accurate, and reproducible calculation based on height and weight. It is taken as one of the markers for assessing nutritional status.[16] Many studies are available in the literature to correlate the relationship between serum leptin levels and BMI in patients with ESRD on hemodialysis with controversial results.
Few studies reported by Iglesias et al.,[17] Nizhizawa et al.,[18] and Lonnqvist et al.[19] had shown a strong direct correlation between serum leptin levels and BMI. This could be attributed to leptin's direct action on hypothalamus.[20] Nevertheless, Merabet et al.[15] and Lonnqvist et al.[19] had shown that there was no correlation between plasma leptin levels and history of weight change during dialysis. The present study further reinforces the direct correlation of serum leptin with BMI in CKD patients on hemodialysis, which is in accordance with the theory of reverse epidemiology.[21] However; the control group did not show any significant correlation to document the same.
A recent study reported by Pecoits et al.[22] on hemodialysis patients suggested a paradoxically inverse association between higher serum leptin levels and markers of nutritional status, a finding that was consistent with the theory of reverse epidemiology given by Kalantar et al. in the same year.[21]
Inflammation has generally been agreed to be one of the reasons for anorexia and hypoalbuminemia in hemodialysis patient.[71222] Subsequently, Nordfors et al.[23] proposed that among the patients with ESRD, leptin gene expression is higher in those who have elevated CRP. Hence it was of interest to examine CRP, the marker of inflammation, and correlate with BMI in hemodialyzed patients.
The mean levels of CRP in this study were significantly and markedly higher in patients with CKD compared with that in controls. These findings are in agreement with the hypothesis proposed by Nordfors et al.[23]
This study failed to establish any correlation between the CRP levels and BMI in patients with ESRD on maintenance hemodialysis. This finding is in close agreement with those reported by Stenvinkel et al.[19] and Viikari.[24] However, Hashimoto et al. had reported significant positive correlation in such patients.[25] This may be attributed to ethnic group differences in physiological norms.
In conclusion, this study demonstrates the superiority of serum leptin vis-à-vis CRP as a biomarker to assess nutritional status in patients with ESRD on hemodialysis.
Source of Support: Nil,
Conflict of Interest: None declared
References
- Centers for Disease Control and Prevention (CDC) In: National chronic kidney disease fact sheet: General information and national estimates on chronic kidney disease in the United States. Atlanta, GA: U.S. Department of Health and Human Services (HHS), CDC; 2010.
- [Google Scholar]
- End-stage renal disease in the developing world: The India experience perspective. Renal Failure. 2004;26:201-8.
- [Google Scholar]
- Relationship between serum leptin level and laboratory and anthropometric indices of malnutrition in patients on hemodialysis. Indian J Nephrol. 2008;18:105-11.
- [Google Scholar]
- Pathophysiological and clinical aspects of malnutrition in chronic renal failure. Nutr Res Rev. 2005;18:89-97.
- [Google Scholar]
- Evaluation of the role of serum leptin in hemodialysis patients. Indian J Nephrol. 2002;12:69-72.
- [Google Scholar]
- Inflammation enhances cardiovascular risk and mortality in hemodialysis patients. Kidney Int. 1999;55:648-58.
- [Google Scholar]
- A formula to estimate the approximate surface area if height and weight be known. Arch Int Med. 1916;17:863-71.
- [Google Scholar]
- Should clearance be normalised to body surface or to lean body mass? Br J Clin Pharmacol. 1981;11:523-6.
- [Google Scholar]
- Revised European best practical guidelines for the management of anaemia in patients with chronic renal failure. Nephrol Dial Transplant. 2004;19:ii1-47. S20-30
- [Google Scholar]
- Nutritional status assessed from anthropometric measures in HEMO study. J Ren Nutr. 2003;13:31-8.
- [Google Scholar]
- Factors predicting malnutrition in hemodialysis patients: A cross-sectional study. Kidney Int. 1998;53:773-82.
- [Google Scholar]
- Positional cloning of the mouse obese gene and its human homologue. Nature. 1994;372:425-32.
- [Google Scholar]
- Leptin in peritoneal dialysate from continuous ambulatory peritoneal dialysis patients. Am J Kidney Dis. 1999;34:832-8.
- [Google Scholar]
- Increase plasma leptin concentration in end-stage renal disease. J Clin Endocrinol Metab. 1997;82:847-50.
- [Google Scholar]
- Nutritional requirements in hemodialysis. In: Mitch WE, Klahr S, eds. Handbook of nutrition and kidney. Philadelphia: Lippincott Williams and Wilkins; 2005. p. :218-227.
- [Google Scholar]
- Serum concentration of leptin, adiponectin and resistin, and their relationship with cardiovascular disease in patients with end-stage renal disease. Clin Endocrinol (Oxf). 2005;62:242-9.
- [Google Scholar]
- Plasma leptin level and its relationship with body composition in hemodialysis patients. Am J Kidney Dis. 1998;31:655-61.
- [Google Scholar]
- Serum leptin concentration correlate to plasma insulin concentrations independent of body fat content in chronic renal failure. Nephrol Dial Transplant. 1997;12:1321-5.
- [Google Scholar]
- Recombinant mouse OB protein: Evidence for a peripheral signal linking adiposity and central neural networks. Science. 1995;269:546-9.
- [Google Scholar]
- Reverse epidemiology of cardiovascular risk factors in maintenance dialysis patients. Kidney Int. 2003;63:793-808.
- [Google Scholar]
- End-stage renal disease: A state of chronic inflammation of hyperleptinemia. Eur J Clin Invest. 2003;33:527-8.
- [Google Scholar]
- Low leptin gene expression and hyperleptinemia in chronic renal failure. Kidney Int. 1998;54:1267-75.
- [Google Scholar]
- Relationship between leptin and C-reactive protein in young Finnish adults. J Clin Endocrinol Metab. 2007;92:4753-8.
- [Google Scholar]
- Strong association of C-reactive protein with body mass index and 2-h post-challenge glucose in non-diabetic, non-smoker subjects without hypertension. Diabet Med. 2004;21:581-5.
- [Google Scholar]