

Translate this page into:
Biomarker response to contrast administration in diabetic and nondiabetic patients following coronary angiography
This is an open access article distributed under the terms of the Creative Commons Attribution-NonCommercial-ShareAlike 3.0 License, which allows others to remix, tweak, and build upon the work non-commercially, as long as the author is credited and the new creations are licensed under the identical terms.
This article was originally published by Medknow Publications & Media Pvt Ltd and was migrated to Scientific Scholar after the change of Publisher.
Abstract
Neutrophil gelatinase-associated lipocalin (NGAL) and cystatin C represent early renal injury markers for contrast-induced nephropathy (CIN). Baseline parameters such as type and quantity of contrast, patient preparation, renal function status, and diabetes mellitus (DM) are known to affect the response of the kidney to contrast-induced injury. This study was taken up to know the biomarker response to contrast administration in 58 diabetic and 59 nondiabetic male patients with same baseline parameters and baseline serum creatinine <1.2 mg/dl undergoing coronary angiography and their role in predicting the development of CIN. Serum creatinine, serum cystatin C, and urinary-NGAL (u-NGAL) were analyzed at baseline (0 h), 4 h, and 24 h after the administration of contrast medium. CIN was defined as a 25% increase in serum creatinine concentration from the baseline value or an absolute increase of at least 0.5 mg/dl within 48 h after the administration of contrast media. Serum creatinine rose 24 h after contrast administration in the diabetic group compared to 48 h in the nondiabetic group. Serum cystatin C levels rose 24 h after contrast administration in both the groups. The earliest marker to rise in both the groups was u-NGAL at 4 h. Diabetic patients had significantly higher u-NGAL (P = 0.005), and serum creatinine levels (P = 0.008) 4 h, and 24 h after contrast administration, respectively. Serum creatinine and u-NGAL/creatinine at 4 h were found to be the best predictors of CIN in the DM and non-DM patients, respectively. Biomarker response to contrast administration is different in diabetic and nondiabetic patients following contrast administration. Diabetic patients exhibit early and greater degree of renal impairment compared to the nondiabetic patients irrespective of the outcome. We propose the use of serum creatinine in patients with DM and u-NGAL/creatinine in non-DM patients to identify CIN as early as 4 h after contrast administration.
Keywords
Biomarkers
contrast-induced nephropathy
coronary angiography
cystatin C
urinary-neutrophil gelatinase-associated lipocalin

Introduction
Contrast-induced nephropathy (CIN) is an important complication following intravascular use of iodinated contrast medium for diagnostic cardiac angiography and coronary interventions, and the third leading cause of hospital-acquired acute kidney injury (AKI).[1] The principle pathophysiologic mechanism underlying CIN is its direct cytotoxic effect on proximal tubular cells.[2] The current definition of CIN is based on the changes in serum creatinine levels after the administration of contrast medium. However, serum creatinine represents a glomerular functional marker rather than an injury marker. In addition, the rise in serum creatinine is late after the insult. Hence, there is a need for injury-based markers which rise early after the insult. As part of this search, a number of novel biomarkers such as neutrophil gelatinase-associated lipocalin (NGAL), cystatin C, and kidney injury molecule which could represent injury following contrast administration have been studied.
NGAL levels have been shown to rise as early as 2 h and 4 h in plasma and urine, respectively[34] while serum cystatin C has been shown to rise 24 h after contrast medium exposure[5] in patients undergoing angiography/angioplasty. Urinary-NGAL (u-NGAL) at 4 h has been shown to have good sensitivity and specificity for diagnosing CIN compared to creatinine.[6]
However, the reports published till date varied in the baseline parameters such as type and dose of contrast, basal serum creatinine, and patient preparation. Patient-related risk factors such as advanced age, presence of diabetes mellitus (DM),[7] hypertension[8] baseline renal insufficiency,[9] arterial hypotension, hypovolemia, hypercholesterolemia, hyperuricemia, and female gender along with procedure-related risk factors such as osmolality of contrast media,[10] volume,[3] and route of administration can influence the development of CIN as well as biomarker concentration. Diabetic patients are at increased risk of developing CIN.[11] Apart from these factors, use of statins can also influence biomarker levels.[12]
Furthermore, the subjects included in many studies were either nondiabetic[13] or both diabetic and nondiabetic patients in the same group.[3451415161718] Very few studies have compared the biomarker response between diabetic and nondiabetic patients and none of the studies reported the predictive value of the biomarkers in diabetic and nondiabetic individuals with same baseline parameters. Hence, there is a need to know the biomarker response to contrast administration in diabetic and nondiabetic patients with same baseline parameters undergoing coronary angiography and their role in predicting the development of CIN. With this aim, this study was taken up.
Materials and Methods
In this prospective longitudinal study, consecutive patients scheduled to undergo coronary angiography and/or angioplasty at a Tertiary Care Center in South India were screened. The study was approved by the Institutional Ethical Committee and written informed consent was obtained from every subject. Two thousand five hundred and sixty patients were screened. Patients with baseline serum creatinine ≤1.2 mg/dl were eligible for the study. Patients with preexisting renal disease, hypotension, hyperthyroidism, hypothyroidism, those on glucocorticoid therapy, cardiogenic shock, or allergy to contrast media, and patients not willing to participate in the study were excluded. Of these 560 patients, who met the inclusion criteria, 415 patients were excluded as they refused to participate since they were not willing for multiple sample collection. Of the 145 recruited patients, the study could not be completed in 25 patients as one or more timed samples could not be collected due to noncompliance from the patient side. Since there were only three females, they too were excluded to make the study group homogenous as gender is known to influence the renal response to contrast injury.[19] Finally, the study cohort composed of 58 patients in DM group, and 59 patients in nondiabetic group.
As per the institutional guidelines, the patients were recommended liberal intake of oral fluid before the procedure. Each patient received a low-osmolal contrast agent; iohexol (Omnipaque 320 mg iodine/mL) (Wipro GE Health Care Private Limited, New Delhi).
In all subjects, anthropometric measurements including height, weight, systolic and diastolic blood pressure, history of DM, hypertension, smoking, and alcohol consumption were recorded, and body mass index was calculated. The procedure-related variables such as dose of the contrast, duration of procedure, and ejection fraction were recorded at the time of the procedure.
u-NGAL, serum creatinine, and serum cystatin C levels were evaluated before (baseline 0 h) 4 h and 24 h after contrast administration. Serum creatinine was measured additionally at 48 h. u-NGAL concentrations were measured using commercially available ELISA kit from BioPorto Diagnostics (KIT 037), (Gentofte, Denmark) on Chemwell automated analyzer, USA. Serum cystatin C was measured by immunoturbidimetric method (Accurex Biomedical Pvt. Ltd., Mumbai, India) on Beckman synchron CX9 autoanalyser, USA. All measurements were performed according to the manufacturer's protocol. Serum creatinine was measured by Jaffe's rate method with calibration traceable to isotope dilution mass spectrometry (IDMS) reference method using the National Institutes of Standards and Technology standard reference material 967 using Beckman system pack on Beckman DxC600 analyzer, USA.
Estimated glomerular filtration rate was calculated for all patients according to the Cockcroft-Gault formula.[20] The primary outcome of the study, i.e., CIN was defined as a 25% increase in serum creatinine concentration from the baseline value, or an absolute increase of at least 0.5 mg/dl within 48 h after the administration of contrast media.[2]
Statistical analysis
Values are expressed as mean ± standard deviation for continuous variables and as frequency (number [%]) for categorical variables. u-NGAL was corrected for urinary creatinine to nullify the effect of urine volume changes over time, which can influence the interpretation. As the biomarker concentrations are affected by factors such as baseline renal function, drug therapy (use of statins, angiotensin-converting enzyme inhibitors, and β-blockers), which act as confounding factors, the data were transformed to percentages taking the 0 h value as 100%. The time course changes of each marker were compared using the analysis of variance for repeated measures followed by Bonferroni's multiple comparison tests or nonparametric Friedman's test and Wilcoxon's signed-rank test for paired comparison, where appropriate.
Mann–Whitney U-test and independent samples t-test were used to test the difference between the groups as appropriate. Categorical variables were tested using Chi-square test.
Logistic regression analysis was performed to assess the diagnostic relevance of the markers studied. Receiver operating characteristic (ROC) curves were constructed to study the diagnostic accuracy of the markers. A cut-off value with the best combination of sensitivity and specificity to diagnose CIN was determined from the ROC curve.
Statistical analysis was performed using Microsoft Excel spreadsheets, SPSS software for windows version 11.5 program (SPSS Inc., Chicago, IL, USA) and MedCalc 12.2.1 version (Broekstraat, Mariakerke, Belgium). P < 0.05 was considered statistically significant.
Results
The baseline parameters of the diabetic and nondiabetic patients are depicted in Table 1. There was no significant difference in the diabetic and nondiabetic groups except for the use of statins, β-blockers, and diuretics were significantly higher in the diabetic group compared to the nondiabetic group (P < 0.05).

Biomarker response to contrast medium administration in the diabetic and nondiabetic groups
Table 2 shows the time course changes in the diabetic and nondiabetic groups. Serum creatinine rose 24 h after contrast administration in the diabetic group compared to 48 h in the nondiabetic group. Serum cystatin C levels rose 24 h after contrast administration in both the groups. The earliest marker to rise in both the groups was u-NGAL 4 h after contrast administration.

Comparison of biomarkers between diabetic and nondiabetic groups
Diabetic patients had significantly greater increase in u-NGAL (P = 0.005), and serum creatinine levels (P = 0.008) 4 h, and 24 h after contrast administration, respectively. Serum cystatin C levels were similar between the two groups.
Incidence of contrast-induced nephropathy
The incidence of CIN in the diabetic group was 24.1% (n = 14/58) whereas in the nondiabetic group, it was 20.3% (n = 12/59).
Biomarker response in the diabetic contrast-induced nephropathy and noncontrast-induced nephropathy groups
Table 3 shows the time course changes in the diabetic CIN and non-CIN groups. Among the diabetic patients who developed CIN, serum creatinine, and u-NGAL rose significantly 4 h after contrast administration (P = 0.027 and P = 0.001, respectively). Serum cystatin C rose significantly 24 h after contrast administration (P = 0.010).

Diabetic non-CIN patients also showed a significant increase in u-NGAL 4 h after contrast administration (P = 0.001). A transient rise in serum creatinine was seen 24 h after contrast administration (P = 0.014) which decreased at 48 h. No change in serum cystatin C levels was seen in these patients (P = 0.299).
Serum creatinine and serum cystatin C levels at 24 h were significantly higher in the diabetic CIN group compared to the non-CIN group (P = 0.000, P = 0.005) whereas u-NGAL levels although higher in the diabetic CIN group compared to the non-CIN group was statistically insignificant (P = 0.207) [Figure 1].
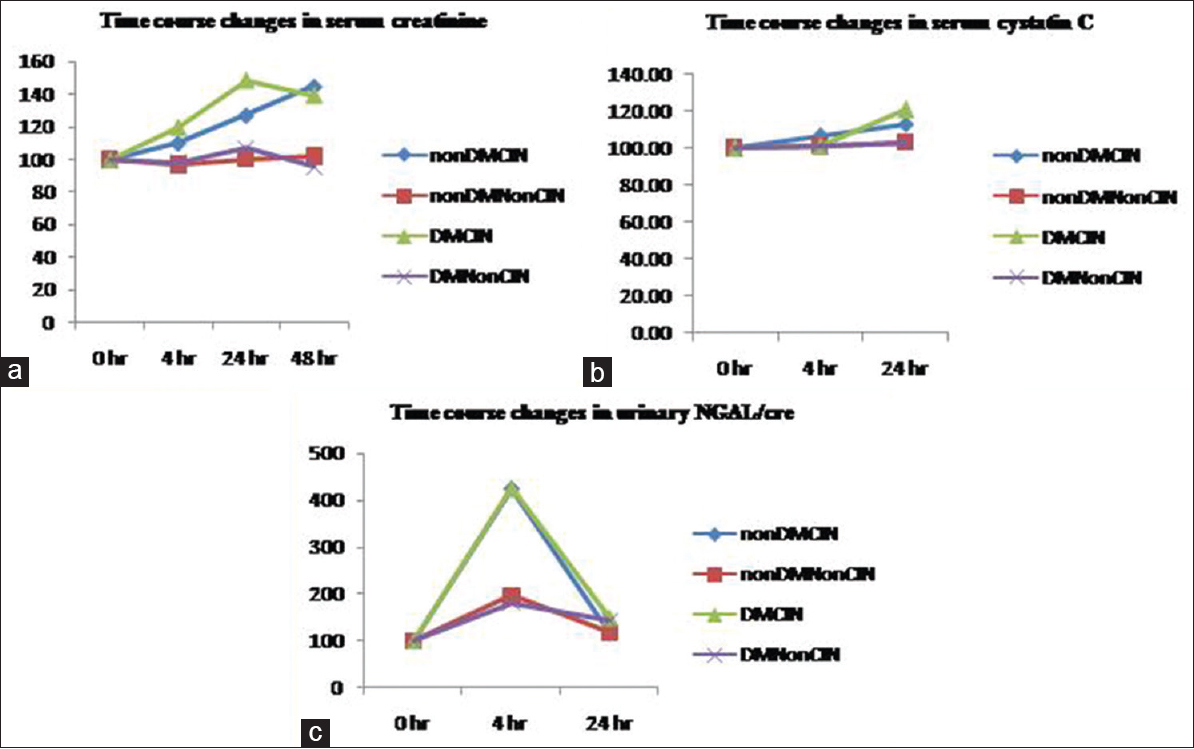
- Time course changes in markers in the diabetic and nondiabetic patients based on the outcome. The data were transformed to percentages with baseline value as 100% to remove the bias of confounding variables. Values are means for serum creatinine and serum cystatin C and median for urinary neutrophil gelatinase- associated lipocalin. (a) Changes in serum creatinine levels. (b) Changes in serum cystatin C levels. (c) Changes in urinary neutrophil gelatinase-associated lipocalin
Biomarker response in the nondiabetic contrast-induced nephropathy and noncontrast-induced nephropathy groups
Table 4 shows the time course changes in the nondiabetic CIN and non-CIN groups. In the nondiabetic CIN group, u-NGAL was the earliest to rise at 4 h (P = 0.003) whereas both serum creatinine and serum cystatin C rose at 24 h (P = 0.024, P = 0.036, respectively).
Nondiabetic, non-CIN patients also showed a rise in u-NGAL 4 h (P = 0.000) after contrast administration which decreased at 24 h. No change in serum creatinine and serum cystatin C levels was seen in these patients (P = 0.129, P = 0.412, respectively).
Nondiabetic CIN group had significantly higher u-NGAL (P = 0.026) at 4 h and serum creatinine (P = 0.001) and serum cystatin C (P = 0.040) 24 h after contrast administration compared to the non-CIN group [Figure 1].
Diagnostic value of biomarkers in patients with diabetes mellitus
In patients with DM, delta change in serum creatinine levels 4 h after contrast medium showed the best diagnostic performance (odd's ratio 1.143 [1.044–1.253]; area under curve [AUC] =0.866, P = 0.000 Figure 2a) followed by serum cystatin C levels 24 h after contrast administration (Odd's ratio: 1.071 [1.022–1.122] AUC = 0.755, P = 0.005).
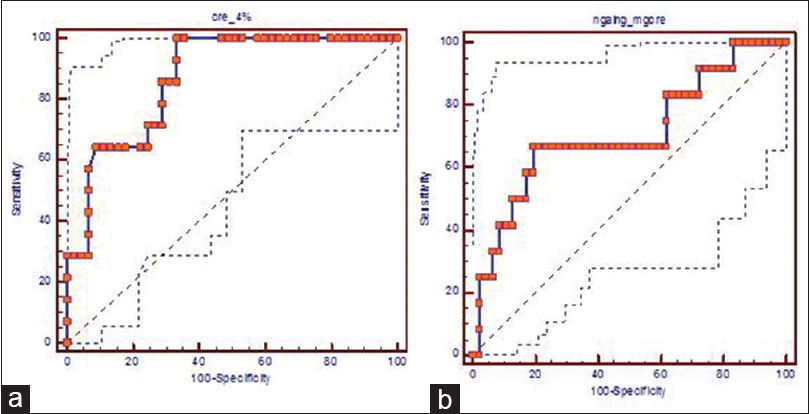
- Receiver operating characteric curve analysis (a) delta percentage change in serum creatinine at 4 h in diabetic patients (b) urinary-neutrophil-gelatinase associated lipocalin/creatinine at 4 h in nondiabetic patients. NGAL: Neutrophil gelatinase-associated lipocalin
Diagnostic value of biomarkers in the nondiabetic group
In the nondiabetic patients, u-NGAL/creatinine 4 h after contrast administration showed the best diagnostic performance (odd's ratio: 1.002 [1.000–1.003], AUC = 0.709, P = 0.026 cut-off value - 343.4 ng/mg creatinine Figure 2b) followed by serum cystatin C levels 24 h after contrast administration (odd's ratio: 1.049 [1.002–1.098] AUC = 0.695, P = 0.040).
Discussion
The results of our study show that biomarker response to contrast administration is different in the diabetic and nondiabetic patients and patients with diabetes show renal impairment early compared to the nondiabetic patients.
The findings of a rise in u-NGAL 4 h and serum cystatin C 24 h after contrast administration in this study are similar to that reported previously.[14] Malyszko et al.[14] compared the biomarker levels between diabetic and nondiabetic patients but did not assess the biomarker response following development of CIN in the two groups separately. The authors[14] reported an increase in u-NGAL 4 h after coronary angiography and a rise in serum cystatin C 8 h after the procedure, which peaked at 24 h in the CIN group (diabetic + nondiabetic patients) in comparison to the non-CIN group (diabetic + nondiabetic patients). However, serum creatinine levels were not measured 4 h after contrast administration in this study. Similar findings were reported in an Indian study.[18] Bachorzewska-Gajewska et al.[4] have only reported the preprocedure serum NGAL levels to be higher in the diabetic patients compared to the nondiabetic patients and did not compare biomarker levels following administration of contrast medium.
A number of factors can influence biomarker levels such as the type, dose, and route of contrast medium administered, and the presence of risk factors such as pre-existing renal impairment, diabetes, and medications.
The type of contrast medium used in the above studies was not the same in all the patients, with some having received low-osmolal contrast and some iso-osmolal contrast medium in the study by Malyszko et al.,[14] whereas high-osmolal contrast medium and low-osmolal contrast medium were used by Bachorzewska-Gajewska et al.[4] Nephrotoxicity of contrast media is dependent on the type of contrast medium, with low-osmolal, nonionic contrast media being more nephrotoxic compared to iso-osmolal contrast medium.[8] This was further confirmed in the study by Malyszko et al.,[14] with the diabetic patients who received low-osmolal contrast medium having significantly higher u-NGAL levels 4 h after percutaneous coronary intervention compared to diabetic patients who received iso-osmolal contrast agent. Thus, the biomarker response in the two groups receiving different contrast medium cannot be generalized and hence points to the need of studying the markers in a homogenous group receiving the same type of contrast medium.
The presence of DM itself can affect biomarker levels.[10] In this study, no significant difference in the baseline levels of these markers was noted between the diabetic and non-diabetic groups. The degree of renal damage as evidenced by a rise in u-NGAL/creatinine was similar in the diabetic subgroup who developed CIN as well as those who did not (P = 0.207). This shows that diabetic individuals, irrespective of the outcome, suffer significant renal damage following contrast administration and should be monitored closely so as to identify renal impairment early before the rise in serum creatinine, which might manifest later.
Similarly, we also observed a rise in u-NGAL/creatinine 4 h after contrast administration in the nondiabetic patients who developed CIN as well as the non-CIN group. However, nondiabetic CIN patients had significantly higher levels compared to the non-CIN group (P = 0.028) [Figure 1c] in our study. This is in agreement with Luo et al.[5] In our study, u-NGAL/creatinine 4 h after contrast administration with a cut-off value of >343.4 ng/mg creatinine showed diagnostic accuracy for predicting CIN in nondiabetic patients [Figure 2] but not in patients with DM.
Cystatin C, another novel biomarker studied, has been reported to be superior to serum creatinine in predicting CIN.[1617] A rise in serum creatinine was seen early at 4 h in the diabetic group. This is a true rise as a result of contrast-induced renal dysfunction and not an apparent rise due to hemoconcentration as observed from the simultaneous measurement of serum albumin levels, which showed a fall [Table 2]. However, Ribichini et al.[21] found a 15% delta shift in creatinine at 12 h to perform better than a corresponding delta shift in cystatin C. In our study too, we found that 4 h serum creatinine was a better predictor of CIN compared to serum cystatin C which could predict CIN only at 24 h in patients with DM. However, in the nondiabetic patients, 4 h serum creatinine could not predict CIN whereas 24 h serum cystatin C could predict CIN as in the case of diabetic group.
The cut-off value for delta percentage change in serum creatinine at 4 h with the best combination of sensitivity and specificity obtained in our study was 1.1% increment from baseline (100% sensitivity and 66.7% specificity). However, both time and percentage change needs to be judged before proposing this for clinical use. Serum creatinine is often said to rise only after 50% of the renal function has been lost, and a significant rise takes 48–72 h to manifest. However, Waikar et al.[22] demonstrated that percentage changes in serum creatinine after severe AKI are highly dependent on baseline kidney function. Time to reach a 50% increase varies from 4 h for those with normal baseline renal function to 27 h from Stage 4 chronic kidney disease. Hence, the changes in serum creatinine at 4 h after contrast administration are most likely due to loss of kidney function and changes at this time point can be used to predict kidney injury due to contrast administration.
Further, 1.1% increment in serum creatinine value has to be interpreted taking into account the analytical and biological variability of creatinine. For creatinine, the analytical variability by IDMS calibration method is <3% whereas the intra-individual variation is 4.7% with a total allowable error of <8%.[23] Hence, our finding of 1.1% may not be a clinically viable recommendation. Serum creatinine change <8% cannot be considered as a clinically significant change. Ribichini et al.[21] suggested a 5% change in creatinine at 12 h could predict CIN with 75% sensitivity and 72% specificity. In our study, when a 5% change was considered, the sensitivity was 78.6% and specificity was 71.5% whereas a 10% change corresponded to a 57.1% sensitivity and 93.3% specificity. Accordingly, we propose 5% change at 4 h to be predictive of CIN in diabetic group.
The results of our study show that diabetic individuals in spite of having normal baseline renal function may have subclinical renal impairment which makes them more susceptible to contrast-induced renal damage and thus have early and more marked rise in markers after contrast administration compared to the nondiabetic patients.
Reported incidence of CIN in patients with normal baseline renal function varies from 2% to 50% and is dependent on the presence of diabetes, the type and volume of contrast medium used as well as the preprocedure prophylaxis. Low-osmolal, nonionic contrast media have been shown to be more nephrotoxic compared to iso-osmolal contrast medium.[8] The incidence using high-osmolal contrast agents in a recent study was found to be 51.4%.[24] Incidence is lower among those who receive prophylactic measures (saline hydration, N-acetylcysteine, theophylline) compared to those who do not.[2526]
The results of our study show that the overall behavior of biomarkers is different in both the subgroups of diabetic and nondiabetic patients who develop CIN [Tables 2 and 3]. Hence, studying their behavior after sub-classification is important so that the correct biomarker panel can be chosen to identify these patients early and thus institute treatment early and prevent adverse events. We propose the use of serum creatinine in patients with DM and use of u-NGAL/creatinine in nondiabetic patients to identify CIN as early as 4 h after contrast administration. u-NGAL/creatinine can thus be useful in nondiabetic patients in whom the rise in creatinine will occur later and are likely to be missed since they are often considered to be at low-risk and receive less attention compared to the diabetic individuals.
The strength of our study is the inclusion of a homogenous group of diabetic and nondiabetic patients receiving the same type of contrast medium and preprocedure preparation. The results from two studies, one involving diabetic and another involving nondiabetic cohort may not reflect the true picture since factors such as selection of study subjects, type of contrast medium used, prophylaxis given, interventional procedure-related variables, and biomarker measurement-related variables all can significantly affect the final outcome.
Limitation
It is a single centered study. Furthermore, our results may not apply to females. Hence, the findings of our study need to further evaluated in female diabetic and nondiabetic patients.
Financial support and sponsorship
Sri Balaji Arogya Varaprasadini scheme of “Sri Venkateswara Institute of Medical Sciences, Tirupati” (Roc. No. A&E/17/RC/SVIMS/10).
Conflicts of interest
There are no conflicts of interest.
References
- Lights and shadows on the pathogenesis of contrast-induced nephropathy: State of the art. Nephrol Dial Transplant. 2005;20:1542-50.
- [Google Scholar]
- Could neutrophil-gelatinase-associated lipocalin and cystatin C predict the development of contrast-induced nephropathy after percutaneous coronary interventions in patients with stable angina and normal serum creatinine values? Kidney Blood Press Res. 2007;30:408-15.
- [Google Scholar]
- Neutrophil-gelatinase-associated lipocalin and renal function after percutaneous coronary interventions. Am J Nephrol. 2006;26:287-92.
- [Google Scholar]
- Implication of combined urinary biomarkers in early diagnosis of acute kidney injury following percutaneous coronary intervention. Clin Nephrol. 2013;79:85-92.
- [Google Scholar]
- Urinary IL-18 and NGAL as early predictive biomarkers in contrast-induced nephropathy after coronary angiography. Nephron Clin Pract. 2008;108:c176-81.
- [Google Scholar]
- Glomerular and tubular damage markers are elevated in patients with diabetes. Diabetes Care. 2011;34:975-81.
- [Google Scholar]
- Relationship between serum cystatin C and hypertension among US adults without clinically recognized chronic kidney disease. J Am Soc Hypertens. 2011;5:378-84.
- [Google Scholar]
- Urinary neutrophil gelatinase-associated lipocalin predicts the severity of contrast-induced acute kidney injury in chronic kidney disease patients undergoing elective coronary procedures. BMC Nephrol. 2013;14:270.
- [Google Scholar]
- Nephrotoxicity in High-Risk Patients Study of Iso-Osmolar and Low-Osmolar Non-Ionic Contrast Media Study Investigators.Nephrotoxic effects in high-risk patients undergoing angiography. N Engl J Med. 2003;348:491-9.
- [Google Scholar]
- Role of adenosine in contrast media-induced acute renal failure in diabetes mellitus. Mayo Clin Proc. 2000;75:1275-83.
- [Google Scholar]
- Effects of atorvastatin on NGAL and cystatin C in chronic kidney disease: A post hoc analysis of the LORD trial. Nephrol Dial Transplant. 2012;27:182-9.
- [Google Scholar]
- Neutrophil gelatinase-associated lipocalin (NGAL) correlations with cystatin C, serum creatinine and eGFR in patients with normal serum creatinine undergoing coronary angiography. Nephrol Dial Transplant. 2007;22:295-6.
- [Google Scholar]
- Urinary and serum biomarkers after cardiac catheterization in diabetic patients with stable angina and without severe chronic kidney disease. Ren Fail. 2009;31:910-9.
- [Google Scholar]
- Diabetic patients with normal baseline renal function are at increased risk of developing contrast-induced nephropathy post-percutaneous coronary intervention. Singapore Med J. 2009;50:250-4.
- [Google Scholar]
- Serum cystatin C is superior to serum creatinine as a marker of kidney function: A meta-analysis. Am J Kidney Dis. 2002;40:221-6.
- [Google Scholar]
- Prediction of contrast-induced nephropathy in patients with serum creatinine levels in the upper normal range by cystatin C: A prospective study in 374 patients. AJR Am J Roentgenol. 2014;202:452-8.
- [Google Scholar]
- Evaluation of the diagnostic performance of new markers for acute kidney injury associated with contrast administration. J Mahatma Gandhi Inst Med Sci. 2013;18:116-21.
- [Google Scholar]
- Female gender and contrast-induced nephropathy in primary percutaneous intervention for ST-segment elevation myocardial infarction. Int J Cardiol. 2014;174:37-42.
- [Google Scholar]
- Comparison of serum creatinine and cystatin C for early diagnosis of contrast-induced nephropathy after coronary angiography and interventions. Clin Chem. 2012;58:458-64.
- [Google Scholar]
- Creatinine kinetics and the definition of acute kidney injury. J Am Soc Nephrol. 2009;20:672-9.
- [Google Scholar]
- Results of the recalibration of creatinine measurement with the modular Beckman Coulter Jaffe creatinine method. Clin Chem Lab Med. 2011;49:1987-99.
- [Google Scholar]
- Do intravenous N-acetylcysteine and sodium bicarbonate prevent high osmolal contrast-induced acute kidney injury? A randomized controlled trial. PLoS One. 2014;9:e107602.
- [Google Scholar]
- A randomized prospective trial to assess the role of saline hydration on the development of contrast nephrotoxicity. Nephron Clin Pract. 2003;93:C29-34.
- [Google Scholar]
- The role of theophylline in contrast-induced nephropathy: A case-control study. Nephrol Dial Transplant. 2002;17:1936-41.
- [Google Scholar]