

Translate this page into:
Induction Therapy and Outcomes following Kidney Transplantation in Recipients of Previous Heart or Liver Transplants
-
Received: ,
Accepted: ,
This article was originally published by Wolters Kluwer - Medknow and was migrated to Scientific Scholar after the change of Publisher.
Abstract
Introduction:
Optimal induction for kidney transplantation in patients with previous nonrenal organ transplantation is unclear. We aimed to evaluate the impact of induction therapy on the outcomes following kidney transplantation in patients who underwent prior heart or liver transplantation.
Methods:
Using the UNOS database, patients who underwent isolated heart or liver transplant from 2000 to 2016 followed by subsequent kidney transplant and maintained on calcineurin inhibitor (CNI)/mycophenolic acid (MPA) regimen were identified and stratified into three groups according to the induction used for kidney transplant: No induction, induction with interleukin-2 receptor antibody (IL-2RA), or T-cell depleting induction with Thymoglobulin. The outcomes were compared between no induction vs. IL-2RA and T-cell depleting induction, and IL-2RA vs. T-cell depleting induction.
Results:
Adjusted risk for delayed graft function was significantly higher for T-cell depleting vs. no induction (OR 4.56, 95% CI 1.14–18.3, P = 0.03) and trended higher for IL-2RA vs. no induction (OR 2.96, 95% CI 0.84–10.33, P = 0.08) among kidney after heart group and significantly higher for T-cell depleting vs. no induction (OR 2.88, 95% CI 1.40–5.95, P = 0.004) and IL-2RA induction (OR 1.88, 95% CI 1.12–3.17, P = 0.02) among kidney after liver patients. Adjusted graft failure and patient death risks were similar in patients who got IL-2RA or depleting inductions vs. no induction and IL-2RA vs. depleting induction groups in kidney after heart and kidney after liver groups.
Conclusions:
The use of induction was not associated with graft or patient survival benefits for kidney transplantation in patients who had prior heart or liver transplants and maintained on CNI and MPA regimen.
Keywords
Induction
nonrenal organ transplants
transplant outcomes

Introduction
Patients who underwent previous nonrenal organ transplants are at increased risk for developing chronic kidney disease (CKD). An earlier registry analysis found that around 16.5% of patients who underwent nonrenal organ transplants developed CKD with a glomerular filtration rate <30 ml/min or end-stage kidney disease (ESKD) during a median follow up of 36 months with a 4.5-fold increase in mortality.[1] In addition to calcineurin inhibitor (CNI) toxicity, comorbidities such as diabetes mellitus, hypertension, chronic hepatitis C infection, and post nonrenal organ transplant acute kidney injury could all be contributing to this high incidence of CKD.[123] The survival of patients who became dialysis dependent following heart or liver transplantation was found to be worse compared to the matched cohort of dialysis patients with no previous non-renal organ transplants, an effect that got abrogated following kidney transplantation.[45] The number of patients with previous nonrenal organ transplants subsequently waitlisted for kidney transplantation has been increasing over the years. An analysis of the Scientific Registry of Transplant Recipients (SRTR) database noted an increase in the waitlisting of such patients from <1% of all listed patients in 1995 to 3.3% in 2008.[6] These patients experienced a higher mortality on the waiting list and enjoyed survival benefit with kidney transplantation when compared to staying on dialysis.[6]
Perioperative antibody induction can decrease acute rejection rates and improve graft survival following kidney transplantation. There has been an increase in the use of induction therapy over the years in the United States and greater than 80% of contemporary kidney transplant recipients (KTRs) receive perioperative induction.[7] The commonly used induction agents include depleting antibodies (Thymoglobulin and alemtuzumab) and the nondepleting antibody such as basiliximab, an interleukin-2 receptor antagonist (IL-2RA). Kidney Disease Improving Global Outcomes (KDIGO) clinical practice guidelines for the care of kidney transplant recipients recommends using induction therapy with a biologic agent as part of the initial immunosuppressive regimen in KTRs with IL2-RA as the firstline agent and lymphocyte-depleting agent in KTRs with high immunologic risk.[8]
There are no clear guidelines regarding the optimal use of induction in nonrenal organ transplant recipients who undergo subsequent kidney transplantation. Choosing an induction agent in such patients can be challenging since these patients are at increased risk for complications such as infection and malignancy due to exposure to cumulative immunosuppression for the earlier nonrenal organ transplant and at higher immunological risk related to alloimmune sensitization from prior organ transplant. We aimed to evaluate the impact of induction therapy on the outcomes of kidney transplantation in patients who underwent prior isolated heart or liver transplantation.
Methods
The study protocol was approved by the Institutional Review Board and the protocols conformed to the ethical guidelines of the 1975 Helsinki Declaration. The clinical and research activities being reported are consistent with the Principles of the Declaration of Istanbul as outlined in the “Declaration of Istanbul on Organ Trafficking and Transplant Tourism.” Using Organ Procurement and Transplant Network (OPTN)/United Network for Organ Sharing (UNOS) thoracic, liver, and kidney transplant database, we identified all the isolated heart transplant recipients and liver transplant recipients between 2000 and 2016 who subsequently underwent isolated kidney-alone transplants and were discharged on CNI/mycophenolic acid (MPA)–based immunosuppressive regimen. Both kidney after heart (KAH) and kidney after liver (KALi) transplant cohorts were stratified into three groups according to the perioperative induction treatment used for the kidney transplant as follows: No induction, induction with interleukin- 2 receptor antibody (IL-2RA, including basiliximab and daclizumab), or induction with a T-lymphocyte depleting antibody, Thymoglobulin. There were only very few patients who received T-lymphocyte depletion with alemtuzumab in both KAH and KAL groups and hence were not included in the analysis.
Statistical analysis
For both KAH and KALi recipients, the outcomes following the subsequent kidney transplantation were compared among the following three groups: Group 1, no induction vs. IL-2 RA induction; group 2: No induction vs. T-cell depleting induction; and group 3: IL-2RA induction vs. T-cell depleting induction. The outcome measures included delayed graft function (DGF, defined as the need for dialysis within the first week following kidney transplant), one-year acute rejection rate, and five-year graft and patient survivals. Information from OPTN/UNOS follow up files was used to estimate the cumulative one-year rejection rates.
Recipient characteristics were compared using Kruskal–Wallis test for continuous variables and Chi square test for categorical variables. The results were shown in absolute numbers and percent. The kidney transplant date was used as the index date and events in the follow up files were observed for five years. Logistic regression was used to define the odds ratio (OR) for DGF and rejection in the first year. The Kaplan–Meier product limit method was used to generate the survival curves and Cox regression was used to define the hazard ratio (HR)–associated with graft failure and death. Overall graft survival was calculated from the time of kidney transplantation until retransplantation, return to dialysis, death or end of follow up. Logistic and Cox regression univariate results were adjusted by multiple confounders, as reported in Table 1. The covariates included in initial multivariate model were: mechanical perfusion, panel reactive antibody (PRA), dialysis duration, recipient sex, human leukocyte antigen (HLA) mismatch, recipient diabetes status, recipient age, cold ischemia time (CIT), steroid use, CNI use, cytomegalovirus (CMV) sero-status, donor age, and kidney donor profile index (KDPI). Only the ones with P < 0.1 were kept in the final models.
| Group 1 | Group 2 | Group 3 | |||||||
|---|---|---|---|---|---|---|---|---|---|
| No induction (n=54) | IL-2RA (n=107) | P | No induction (n=54) | T-cell depleting (n=87) | P | Il-2RA (n=107) | T-cell depleting (n=87) | P | |
| Recipient characteristics | |||||||||
| Age | |||||||||
| 18-39 | 3 (5.6) | 12 (11.2) | 0.49 | 3 (5.6) | 10 (11.5) | 0.21 | 12 (11.2) | 10 (11.5) | 0.49 |
| 40-60 | 23 (42.6) | 41 (38.3) | 23 (42.6) | 26 (29.9) | 41 (38.3) | 26 (29.9) | |||
| >60 | 28 (51.8) | 54 (50.5) | 28 (51.8) | 51 (58.6) | 54 (50.5) | 51 (58.6) | |||
| Gender | |||||||||
| Male | 43 (79.6) | 80 (74.7) | 0.49 | 43 (79.6) | 67 (77) | 0.71 | 80 (74.7) | 67 (77) | 0.71 |
| Race | |||||||||
| Caucasian | 44 (81.5) | 88 (82.2) | 0.33 | 44 (81.5) | 65 (74.7) | 0.39 | 88 (82.2) | 65 (74.7) | 0.02 |
| Black | 8 (14.8) | 9 (8.4) | 8 (14.8) | 19 (21.8) | 9 (8.4) | 19 (21.8) | |||
| Hispanic | 1 (1.85) | 8 (7%) | 1 (1.85) | 3 (3.45) | 8 (7%) | 3 (3.45) | |||
| BMI | |||||||||
| Underweight | 2 (3.7) | 7 (6.5) | 0.95 | 2 (3.7) | 3 (3.45) | 0.45 | 7 (6.5) | 3 (3.45) | 0.26 |
| Normal | 23 (42.6) | 43 (40.2) | 23 (42.6) | 34 (39.10 | 43 (40.2) | 34 (39.10 | |||
| Obese | 9 (16.7) | 19 (17.8) | 9 (16.7) | 8 (9.2) | 19 (17.8) | 8 (9.2) | |||
| Overweight | 16 (29.6) | 33 (30.8) | 16 (29.6) | 37 (42.5) | 33 (30.8) | 37 (42.5) | |||
| Severe obese | 3 (5.6) | 4 (3.7) | 3 (5.6) | 5 (5.7) | 4 (3.7) | 5 (5.7) | |||
| Dialysis duration | |||||||||
| Preemptive | 17 (31.5) | 20 (18.7) | 0.05 | 17 (31.5) | 16 (18.4) | 0.04 | 20 (18.7) | 16 (18.4) | 0.50 |
| ≤1 year | 9 (16.7) | 28 (26.2) | 9 (16.7) | 19 (21.8) | 28 (26.2) | 19 (21.8) | |||
| 1-3 years | 15 (27.) | 46 (43.0) | 15 (27.) | 26 (29.9) | 46 (43.0) | 26 (29.9) | |||
| >3 years | 12 (22.2) | 12 (11.2) | 12 (22.2) | 24 (27.6) | 12 (11.2) | 24 (27.6) | |||
| DM | |||||||||
| Yes | 27 (50.0) | 53 (49.5) | 0.95 | 27 (50.0) | 36 (41.4) | 0.32 | 53 (49.5) | 36 (41.4) | 0.26 |
| CMV | |||||||||
| R+/D+ | 17 (31.5) | 38 (35.5) | 0.50 | 17 (31.5) | 38 (43.7) | 0.15 | 38 (35.5) | 38 (43.7) | 0.31 |
| R+/D- | 17 (31.5) | 42 (39.2) | 17 (31.5) | 27 (31.0) | 42 (39.2) | 27 (31.0) | |||
| R-/D+ | 12 (22.2) | 15 (14.0) | 12 (22.2) | 8 (9.20) | 15 (14.0) | 8 (9.20) | |||
| R-/D- | 8 (14.8) | 11 (10.3) | 8 (14.8) | 14 (16.1) | 11 (10.3) | 14 (16.1) | |||
| Donor characteristics | |||||||||
| Living Kidney Donor | 23 (42.6) | 62 (57.9) | 0.06 | 23 (42.6) | 29 (33.3) | 0.27 | 62 (57.9) | 29 (33.3) | 0.001 |
| Deceased Kidney Donor | 31 (57.4) | 45 (42.1) | 31 (57.4) | 58 (66.7) | 45 (42.1) | 58 (66.7) | |||
| Donor Age <21 | 4 (7.5) | 7 (6.7) | 0.07 | 4 (7.5) | 9 (10.5) | 0.80 | 7 (6.7) | 9 (10.5) | 0.09 |
| 21–65 | 45 (84.9) | 97 (92.4) | 45 (84.9) | 72 (83.7) | 97 (92.4) | 72 (83.7) | |||
| >65 | 4 (7.6) | 1 (0.9) | 4 (7.6) | 5 (5.8) | 1 (0.9) | 5 (5.8) | |||
| KDPI % | 46 (18-78) | 40 (22-67) | 0.67 | 46 (18-78) | 57 (44-75) | 0.23 | 40 (22-67) | 57 (44-75) | 0.001 |
| Transplant characteristics | |||||||||
| Days between Transplants | |||||||||
| Median | 2359 (1377-2926) | 2311 (1177-3338) | 0.96 | 2359 (1377-2926) | 2189 (1024-3470) | 0.96 | 2311 (1177-3338) | 2189 (1024-3470) | 0.93 |
| ABO | |||||||||
| Identical | 50 (92.6) | 86 (80.4) | 0.07 | 50 (92.6) | 76 (87.4) | 0.18 | 86 (80.4) | 76 (87.4) | 0.33 |
| Compatible | 9 (5.6) | 20 (18.7) | 9 (5.6) | 11 (12.6) | 20 (18.7) | 11 (12.6) | |||
| Incompatible | 1 (1.8) | 1 (0.9) | 1 (1.8) | 0 (0) | 1 (0.9) | 0 (0) | |||
| PRA | |||||||||
| Median | 0 (0-10.5) | 0 (0-0) | 0.03 | 0 (0-10.5) | 0 (0-44) | 0.20 | 0 (0-0) | 0 (0-44) | <0.001 |
| Pump | |||||||||
| Yes | 13 (24.1) | 22 (25.3) | 0.87 | 13 (24.1) | 21 (19.6) | 0.51 | 21 (19.6) | 22 (25.3) | 0.35 |
| CIT | |||||||||
| Hours§ | 9.5 (1.25-15.8) | 2.35 (1-15.8) | 0.33 | 9.5 (1.25-15.8) | 11.4 (1.6-18.4) | 0.21 | 2.35 (1-15.8) | 11.4 (1.6-18.4) | 0.02 |
| HLA MM | |||||||||
| 0 | 5 (9.3) | 20 (18.7) | 0.09 | 5 (9.3) | 6 (6.9) | 0.07 | 20 (18.7) | 6 (6.9) | 0.09 |
| 1-2 | 1 (1.85) | 10 (9.4) | 1 (1.85) | 13 (14.9) | 10 (9.4) | 13 (14.9) | |||
| 3-4 | 29 (53.7) | 43 (40.2) | 29 (53.7) | 36 (41.4) | 43 (40.2) | 36 (41.4) | |||
| 5-6 | 19 (35.2) | 34 (31.8) | 19 (35.2) | 32 (36.8) | 34 (31.8) | 32 (36.8) | |||
| CNI at DC | |||||||||
| Yes | 52 (96.3) | 103 (96.3) | 0.99 | 52 (96.3) | 82 (94.2) | 0.58 | 103 (96.3) | 82 (94.2) | 0.50 |
| Steroid at DC | |||||||||
| Yes | 50 (92.6) | 106 (99.1) | 0.02 | 50 (92.6) | 87 (100) | 0.01 | 106 (99.1) | 87 (100) | 0.36 |
BMI, body mass index; CMV, cytomegalovirus; CIT, cold ischemia time; CNI, calcineurin inhibitor; DC, at discharge DM, diabetes Mellitus; HLA, human leukocyte antigen; KDPI, kidney donor profile index; MM, mismatch; PRA, panel reactive antibodies; Pump, mechanical perfusion of the kidney
Variables with >4% of the data missing were excluded from the analysis. The excluded variables were peripheral vascular disease, pretransplant malignancy, recipient hepatitis C virus (HCV), and hepatitis B virus (HBV) sero-status. Covariates included in the multivariate analysis for the KAH transplant recipients were CIT, KDPI, body mass index (BMI), and donor age for DGF; recipient age, CIT, PRA and HLA mismatches for 1-year acute rejection; PRA, HLA mismatch, KDPI, BMI, recipient age and CNI use for graft failure and HLA mismatch, BMI, CMV sero-status, KDPI, recipient age, and CNI use for patient death. For KALi recipients, covariates included in multivariate analysis were dialysis duration, PRA, BMI, recipient diabetes status, CMV sero-status, CIT and recipient age for DGF; dialysis duration, and recipient age for 1-year acute rejection; CMV sero-status, donor age, recipient age, KDPI and BMI for graft failure; and recipient age, CMV status, CNI use, and dialysis duration for patient death. The results were expressed as OR and HR with their 95% confidence interval (CI) and associated P values. All P values were 2-tailed and considered significant if less than 0.05. STATA version 11 (Statacorp, College Station, TX) was used as the statistical tool.
Results
Baseline features
In the KAH group, there were 54 patients who received no induction, 107 who got IL-2RA induction, and 87 who received T-cell depleting induction with Thymoglobulin. The trend in the use of induction over the years is shown in Figure 1a. The demographic features of the groups are shown in Table 1. The T-cell depleting group had more black patients, longer dialysis vintage, higher median PRA titer, longer CIT, and higher KDPI. IL-2RA group had more living donor kidney recipients and more patients with zero HLA mismatches. A higher proportion of patients in the no induction group underwent preemptive kidney transplantation. More people in induction groups were discharged on steroid.
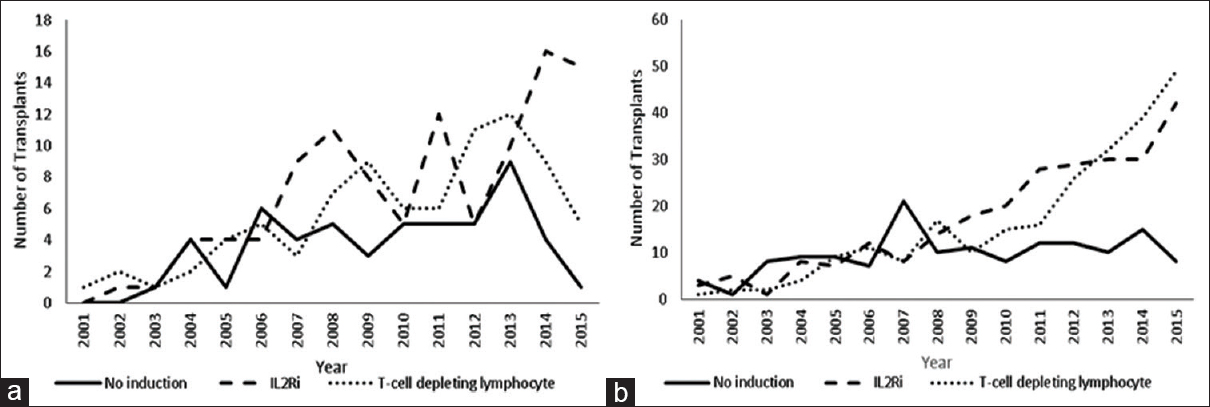
- Trend in the use of induction over the years in kidney after heart (a) and kidney after liver (b) transplant recipients
In the KALi recipients, there were 147 patients in the no induction group, 267 patients in the IL-2RA-induced group and 254 patients in the T-cell depleting group. The trend in the use of induction over the years is shown in Figure 1b. The demographic features of the different groups are shown in Table 2. Patients who underwent T-cell depleting induction had longer dialysis vintage, higher median PRA titer, and lower proportion with HCV sero-positivity. This group also had a longer interval between liver and kidney transplantation. Patients who received no induction were younger and a higher proportion was underweight. A higher proportion of patients in this group had zero HLA mismatches and underwent preemptive transplantation of the kidney. More people in induction groups were discharged on steroid.
| Group 1 | Group 2 | Group 3 | |||||||
|---|---|---|---|---|---|---|---|---|---|
| No induction (n=147) | IL-2RA (n=267) | P | No induction (n=147) | T-cell depleting (n=254) | P | IL-2RA (n=267) | T-cell depleting (n=254) | P | |
| Recipient characteristics | |||||||||
| Age | |||||||||
| 18-39 | 15 (10.2) | 21 (7.8) | 0.03 | 15 (10.2) | 12 (4.7) | 0.009 | 21 (7.8) | 12 (4.7) | 0.33 |
| 40-60 | 75 (51.0) | 107 (40.1) | 75 (51.0) | 108 (42.5) | 107 (40.1) | 108 (42.5) | |||
| >60 | 57 (38.8) | 139 (52.1) | 57 (38.8) | 134 (52.8) | 139 (52.1) | 134 (52.8) | |||
| Gender | |||||||||
| Male | 109 (74.1) | 199 (74.5) | 0.93 | 109 (74.1) | 169 (66.5) | 0.11 | 199 (74.5) | 169 (66.5) | 0.04 |
| Race | |||||||||
| Caucasian | 102 (69.4) | 197 (73.8) | 0.28 | 102 (69.4) | 188 (74.0) | 0.07 | 197 (73.8) | 188 (74.0) | 0.59 |
| Black | 10 (6.8) | 18 (6.7) | 10 (6.8) | 24 (9.4) | 18 (6.7) | 24 (9.4) | |||
| Hispanic | 29 (19.7) | 35 (13.1) | 29 (19.7) | 27 (10.6) | 35 (13.1) | 27 (10.6) | |||
| BMI | |||||||||
| Underweight | 18 (12.2) | 14 (5.2) | 0.12 | 18 (12.2) | 9 (3.5) | 0.008 | 14 (5.2) | 9 (3.5) | 0.03 |
| Normal | 51 (34.7) | 101 (37.8) | 51 (34.7) | 76 (29.9) | 101 (37.8) | 76 (29.9) | |||
| Obese | 22 (15.0) | 42 (15.7) | 22 (15.0) | 56 (22.1) | 42 (15.7) | 56 (22.1) | |||
| Overweight | 47 (31.9) | 84 (31.5) | 47 (31.9) | 97 (38.2) | 84 (31.5) | 97 (38.2) | |||
| Severe obese | 9 (6.12) | 23 (8.6) | 9 (6.12) | 14 (5.5) | 23 (8.6) | 14 (5.5) | |||
| Dialysis duration | |||||||||
| Preemptive | 31 (21.1) | 38 (14.2) | <0.001 | 31 (21.1) | 53 (20.9) | <0.001 | 38 (14.2) | 53 (20.9) | <0.001 |
| ≤1 year | 31 (21.1) | 71 (26.6) | 31 (21.1) | 49 (19.3) | 71 (26.6) | 49 (19.3) | |||
| 1–3 years | 48 (32.6) | 115 (43.1) | 48 (32.6) | 84 (33.1) | 115 (43.1) | 84 (33.1) | |||
| >3 years | 18 (12.2) | 37 (13.9) | 18 (12.2) | 67 (26.4) | 37 (13.9) | 67 (26.4) | |||
| DM | |||||||||
| Yes | 76 (51.7) | 140 (52.4) | 0.88 | 76 (51.7) | 120 (47.2) | 0.39 | 140 (52.4) | 120 (47.2) | 0.24 |
| CMV | |||||||||
| R+/D+ | 62 (42.2) | 130 (48.7) | 0.10 | 62 (42.2) | 114 (44.7) | 0.37 | 38 (35.5) | 114 (44.7) | 0.69 |
| R+/D- | 43 (29.6) | 86 (32.2) | 43 (29.6) | 78 (30.7) | 42 (39.2) | 78 (30.7) | |||
| R-/D+ | 15 (10.2) | 25 (9.4) | 15 (10.2) | 30 (11.8) | 15 (14.0) | 30 (11.8) | |||
| R-/D- | 21 (14.3) | 17 (6.4) | 21 (14.3) | 20 (7.9) | 11 (10.3) | 20 (7.9) | |||
| Hepatitis C | |||||||||
| Serum +ve | 64 (43.5) | 117 (43.8) | 0.95 | 64 (43.5) | 86 (33.9) | 0.05 | 117 (43.8) | 86 (33.9) | 0.02 |
| Donor characteristic | |||||||||
| KDPI | 49.5 (3-65) | 48 (31-71) | 0.22 | 49.5 (3-65) | 52 (34-72) | 0.01 | 48 (31-71) | 52 (34-72) | 0.11 |
| Living Kidney Donor | 55 (37.4) | 110 (41.2) | 0.45 | 55 (37.4) | 77 (30.3) | 0.15 | 110 (41.2) | 77 (30.3)) | 0.01 |
| Deceased Kidney Donor | 92 (62.6) | 157 (58.8) | 92 (62.6) | 177 (69.7) | 157 (58.8) | 177 (69.7) | |||
| Donor Age <21 | 12 (8.2) | 21 (7.9) | 0.97 | 12 (8.2) | 25 (8.4) | 0.67 | 21 (7.9) | 25 (8.4) | |
| 21-65 | 133 (90.5) | 243 (91.1) | 133 (90.5) | 265 (88.9) | 243 (91.1) | 265 (88.9) | |||
| >65 | 2 (1.4) | 3 (1.1) | 2 (1.4) | 8 (2.7) | 3 (1.1) | 8 (2.7) | |||
| Transplant characteristics | |||||||||
| Days between transplants | |||||||||
| median | 1657 (807-2354) | 1681 (982-2851) | 0.22 | 1657 (807-2354) | 1829 (1037-2855) | 0.03 | 1681 (982-2851) | 1829 (1037-2855) | 0.28 |
| ABO | |||||||||
| Identical | 125 (85.0) | 244 (91.4) | 0.05 | 125 (85.0) | 226 (89.0) | 0.05 | 244 (91.4) | 226 (89.0) | 0.43 |
| compatible | 22 (15.0) | 23 (8.61) | 22 (15.0) | 27 (10.6) | 23 (8.61) | 27 (10.6) | |||
| incompatible | 0 (0) | 0 (0) | 0 (0) | 1 (0.4) | 0 (0) | 1 (0.4) | |||
| PRA | |||||||||
| median | 0 (0-18) | 0 (0-8) | 0.26 | 0 (0-18) | 0 (0-57) | 0.01 | 0 (0-8) | 0 (0-57) | <0.001 |
| Pump | |||||||||
| Yes | 33 (22.4) | 67 (25.1) | 0.54 | 33 (22.4) | 73 (28.7) | 0.17 | 67 (25.1) | 73 (28.7) | 0.35 |
| CIT | |||||||||
| Hours§ | 12 (1.6-18) | 11.0 (1.4-19.2) | 0.76 | 12 (1.6-18) | 13.0 (2.8-20.6) | 0.14 | 11.0 (1.4-19.2) | 13.0 (2.8-20.6) | 0.21 |
| HLA MM | |||||||||
| 0 | 15 (10.3) | 11 (4.17) | 0.03 | 15 (10.3) | 23 (9.1) | 0.55 | 11 (4.17) | 23 (9.1) | 0.11 |
| 1-2 | 17 (11.6) | 37 (14.0) | 17 (11.6) | 24 (9.5) | 37 (14.0) | 24 (9.5) | |||
| 3-4 | 54 (37.0) | 101 (38.3) | 54 (37.0) | 112 (44.3) | 101 (38.3) | 112 (44.3) | |||
| 5-6 | 60 (41.1) | 115 (43.6) | 60 (41.1) | 94 (37.1) | 115 (43.6) | 94 (37.1) | |||
| CNI DC | |||||||||
| Yes | 137 (93.2) | 262 (98.1) | 0.01 | 137 (93.2) | 247 (97.2) | 0.05 | 262 (98.1) | 247 (97.2) | 0.50 |
| Steroid DC | |||||||||
| Yes | 129 (87.8) | 262 (98.1) | <0.001 | 129 (87.8) | 251 (98.8) | <0.001 | 262 (98.1) | 251 (98.8) | 0.52 |
BMI, body mass index; CMV, cytomegalovirus; CIT, cold ischemia time; CNI, calcineurin inhibitor; DC, at discharge DM, diabetes Mellitus; HLA, human leukocyte antigen; KDPI, kidney donor profile index; MM, mismatch; PRA, panel reactive antibodies; Pump, mechanical perfusion of the kidney
Outcomes
Delayed graft function and acute rejection rates
Among the KAH group, the incidence of DGF was significantly higher in T-cell depleting vs. no induction groups (21.8% vs. 7.41%, P = 0.02) in group 2 and trended higher in IL-2R-induced vs. no induction groups (18.7% vs. 7.41%, P = 0.06) in group 1. When compared to no induction, those patients who received IL-2 RA induction did not have higher risk for DGF in both unadjusted (OR 2.87, 95% CI 0.92–8.88, P = 0.06) and adjusted (HR 2.96, 95% CI 0.84–10.33, P = 0.08) models. However, patients who received T-cell depleting induction had a significantly higher risk for developing DGF in both unadjusted (OR 3.49, 95% 1.12–10.9, P = 0.03) and adjusted (OR 4.56, 95% CI 1.14–18.3, P = 0.03) models when compared to no induction group. DGF incidence was similar between IL2RA and T-cell depleting groups [Table 3].
| Group 1 | Group 2 | Group 3 | |||||||
|---|---|---|---|---|---|---|---|---|---|
| No induction | IL2ra | P | No induction | T-cell depleting | P | Il2Ra | T-cell depleting | P | |
| Delayed Graft Function | |||||||||
| Incidence | 7.41% | 18.7% | 0.06 | 7.41% | 21.8% | 0.02 | 18.7% | 21.8% | 0.58 |
| Unadjusted risk | control | 2.87 (0.92-8.88) | 0.06 | control | 3.49 (1.12-10.9). | 0.03 | control | 1.21 (0.60-2.45) | 0.58 |
| Adjusted risk | control | 2.96 (0.84-10.33) | 0.08 | control | 4.56 (1.14-18.3) | 0.03 | control | 1.29 (0.61-2.73) | 0.49 |
| Rejection one-year | |||||||||
| Incidence | 17.3 | 10.1 | 0.20 | 17.3 | 8.64 | 0.13 | 10.1 | 8.64 | 0.74 |
| Unadjusted risk | control | 0.53 (0.20-1.41) | 0.20 | control | 0.45 (0.15-1.30) | 0.14 | control | 0.84 (0.30-2.32) | 0.73 |
| Adjusted risk | control | 0.38 (0.13-1.09) | 0.07 | control | 0.52 (0.17-1.53) | 0.24 | control | 1.13 (0.39-3.24) | 0.81 |
| Graft Outcomes | |||||||||
| Five-year survival | 41.1% | 59.6% | 0.13 | 41.1% | 43.0% | 0.58 | 59.6% | 43.0% | 0.31 |
| Graft failure risk, unadjusted | control | 0.65 (0.37-1.15) | 0.14 | control | 0.86 (0.49-1.49) | 0.59 | control | 1.29 (0.76-2.18) | 0.33 |
| Graft failure risk, adjusted | control | 0.71 (0.39-1.29) | 0.26 | control | 0.74 (0.40-1.35) | 0.32 | control | 1.37 (0.81-2.32) | 0.24 |
| Patient Outcomes | |||||||||
| Five-year survival | 40.0% | 65.5% | 0.05 | 40.0% | 47.6% | 0.42 | 65.5% | 47.6% | 0.19 |
| Patient death risk, unadjusted | control | 0.54 (0.29-1.01) | 0.05 | control | 0.80 (0.45-1.41) | 0.44 | control | 1.45 (0.81-2.62) | 0.21 |
| Patient death risk, adjusted | control | 0.64 (0.33-1.25) | 0.20 | control | 0.75 (0.41-1.36) | 0.35 | control | 1.48 (0.80-2.72) | 0.20 |
No induction, n=54; IL2ra, n=107; and T-cell depleting, n=87. Delayed graft function and Rejection one-year risks were estimated by odds-ratio with 95% confidence interval and P. Graft failure and patient death risk were estimated by hazard-ratios with 95% confidence interval and P
Among the KALi group, the incidence of DGF was significantly higher in T-cell depletion–induced vs. recipients of no induction in group 2 (19.7% vs. 9.52%, P = 0.007) and T-cell depleting vs. IL-2RA induced patients in group 3 (19.7% vs. 11.6%, P = 0.01). When compared to no induction, patients who underwent T-cell depleting induction had significantly higher risk for developing DGF in both unadjusted (OR 2.32, 95% CI 1.23–4.37, P = 0.009)) and adjusted (OR 2.88, 95% CI 1.40–5.95, P = 0.004)) models. Similarly, the risk for developing DGF was significantly higher in patients who received T-cell depleting vs. IL-2RA induction in both unadjusted (OR 1.86, 95% CI 1.14–3.03, P = 0.01)) and adjusted (OR 1.88, 95% CI 1.12–3.17, P = 0.02) models [Table 4]. The incidences of 1-year acute rejections were similar in all the three groups for both KAH and KALi groups [Tables 3 and 4].
| Group 1 | Group 2 | Group 3 | |||||||
|---|---|---|---|---|---|---|---|---|---|
| No induction | IL2ra | P | No induction | T-cell depleting | P | Il2Ra | T-cell depleting | P | |
| Delayed Graft Function | |||||||||
| Incidence | 9.52% | 11.6% | 0.51 | 9.52% | 19.7% | 0.007 | 11.6% | 19.7% | 0.01 |
| Unadjusted risk | control | 1.24 (0.64-2.48) | 0.51 | control | 2.32 (1.23-4.37). | 0.009 | control | 1.86 (1.14-3.03) | 0.01 |
| Adjusted risk | control | 1.21 (0.61-2.40) | 0.58 | control | 2.88 (1.40-5.95) | 0.004 | control | 1.88 (1.12-3.17) | 0.02 |
| Rejection one-year | |||||||||
| Incidence | 7.48 | 12.0 | 0.15 | 7.64 | 8.3 | 0.78 | 13.0 | 8.9 | 0.16 |
| Unadjusted risk | control | 1.68 (0.82-3.44) | 0.15 | control | 1.11 (0.52-2.38) | 0.78 | control | 0.66 (0.36-1.18) | 0.16 |
| Adjusted risk | control | 1.71 (0.80-3.61) | 0.16 | control | 0.96 (0.44-2.09) | 0.992 | control | 0.67 (0.37-1.21) | 0.18 |
| Graft Outcome | |||||||||
| Five-year survival | 70.8% | 75.3% | 0.63 | 70.8% | 69.3% | 0.74 | 75.3% | 69.3% | 0.94 |
| Graft failure risk, unadjusted | control | 0.85 (0.52-1.39) | 0.53 | control | 1.02 (0.63-1.62) | 0.92 | control | 1.12 (0.72-1.73) | 0.58 |
| Graft failure risk, Adjusted | control | 0.87 (0.52-1.44) | 0.59 | control | 0.94 (0.57-1.53) | 0.52 | control | 1.04 (0.66-1.64) | 0.23 |
| Patient Outcome | |||||||||
| Five-year survival | 73.7% | 77.5% | 0.53 | 73.7% | 72.9% | 0.66 | 77.5% | 72.9% | 0.89 |
| Patient death risk, unadjusted | control | 1.11 (0.75-1.64) | 0.59 | control | 0.95 (0.57-1.57) | 0.84 | control | 1.09 (0.68-1.76) | 0.71 |
| Patient death risk, adjusted | control | 1.09 (0.73-1.63) | 0.65 | control | 0.88 (0.53-1.45) | 0.62 | control | 1.09 (0.67-1.76) | 0.71 |
No induction, n=147; IL2ra, n=267; and T-cell depleting, n=254. Delayed graft function and Rejection one-year risks were estimated by odds-ratio with 95% confidence interval and P. Graft fail and patient death risk were estimated by hazard-ratios with 95% confidence interval and P
Graft survival
The Kaplan–Meier graft survivals among KAH recipients by induction type are shown in Figure 2a. Five-year graft survivals were similar in all the three groups as shown in Table 3. Graft failure risks were similar in unadjusted and adjusted models in both IL-2 RA and T-cell depletion–induced patients compared to no induction group and T-cell depleting vs. IL-2RA groups [Table 3]. The Kaplan–Meier graft survivals of KALi recipients by induction type are shown in Figure 2b. The unadjusted and adjusted graft failure risks were similar in IL-2RA and T-cell depletion–induced groups compared to no induction group and between IL-2RA and T-cell depletion–induced groups as shown in Table 4.
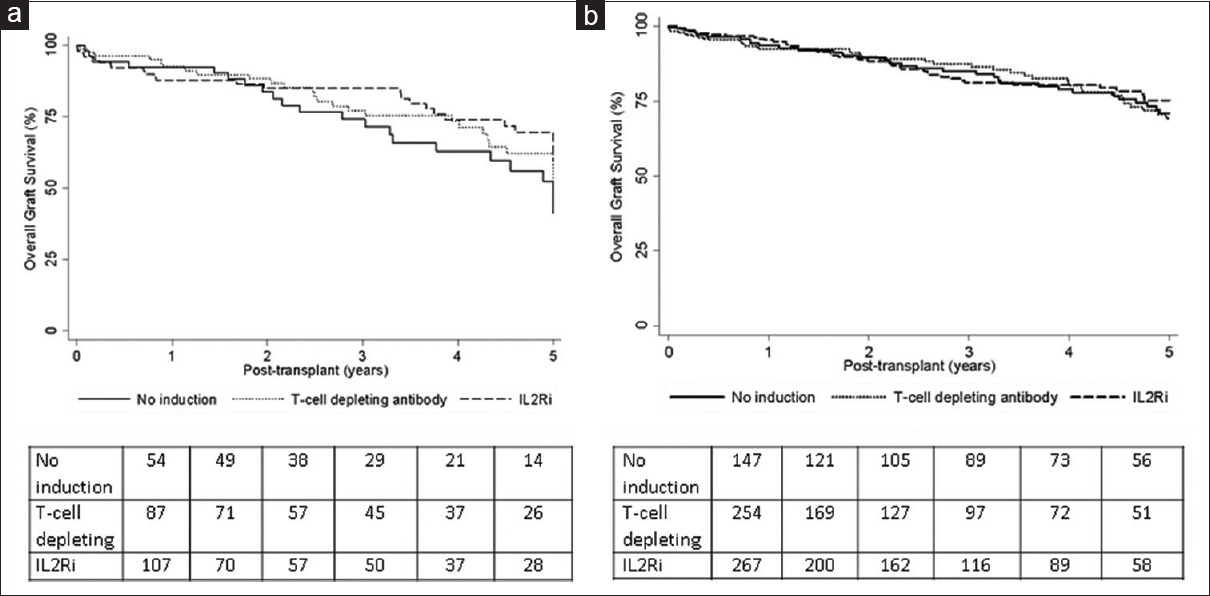
- Kaplan–Meier graft survivals for kidney after heart (a) and kidney after liver (b) transplant recipients by induction type
Patient survival
The Kaplan–Meier patient survivals of KAH recipients by induction type are shown in Figure 3a. The five-year patient survival trended superior for IL-2RA induced vs. no induction recipients in group 1 (65.5% vs. 40%, P = 0.05) but similar for no induction vs. T-cell depletion–induced patients in group 2 and IL-2RA vs. T-cell depletion induction in group 3 as shown in Table 3. Patient death risk trended lower in IL2RA induced vs. no induction patients in group 1 in unadjusted model (HR 0.54, 95% CI 0.29–1.01, P = 0.05) but similar in the adjusted model (HR 0.64, 95% CI 0.33–1.25, P = 0.20). Patient death risks were similar in unadjusted and adjusted models in T-cell depletion–induced patients compared to no induction in group 2 and T-cell depleting vs. IL-2RA induction in group 3 [Table 3]. Kaplan–Meier patient survivals of KALi recipients by induction type are shown in Figure 3b. Unadjusted and adjusted graft failure risks were similar in IL-2RA and T-cell depletion–induced groups compared to no induction group and between IL-2RA and T-cell depletion–induced groups as shown in Table 4.
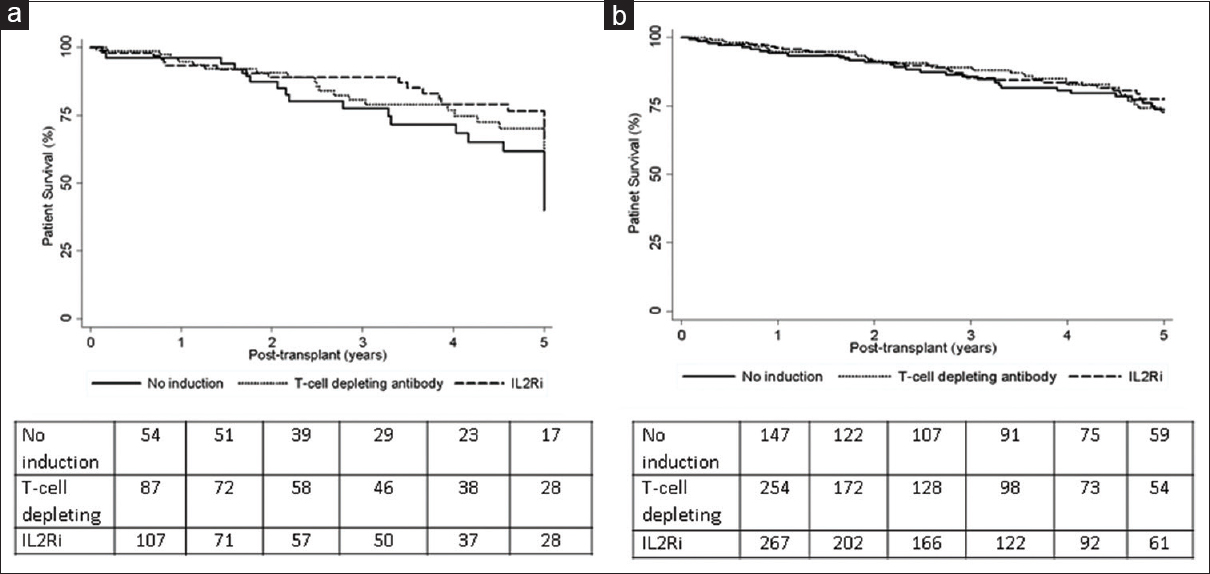
- Kaplan–Meier patient survivals for kidney after heart (a) and kidney after liver (b) transplant recipients by induction type
Discussion
Our analysis showed a similar 5-year graft and patient survivals associated with perioperative induction using either IL-2RA or T-cell depleting agents compared to no induction for kidney transplantation in patient who received previous heart or liver transplantation and discharged on CNI/MPA-based immunosuppression following the kidney transplantation. Graft and patient survivals were similar between IL2-RA and T-cell depleting agent induced groups. The risks for developing 1-year acute rejections were also similar.
Patients who undergo kidney transplantation after receiving nonrenal organs earlier are medically and immunologically complex. They are generally considered to be at high risk immunologically due to the earlier exposure to alloantigens stemming from the nonrenal organ transplant and hence in perceived need for robust immunosuppression. Yet, at the same time, these patients may be more susceptible to the adverse consequences of cumulative immunosuppression. As mentioned, the KDIGO clinical practice guidelines recommend using induction therapy with the biologic agent IL2-RA as the first line agent and lymphocyte-depleting agent in KTRs with high immunologic risk.[8] Yet, these guidelines did not specifically address nonrenal organ recipients undergoing kidney transplantation. An increasing number of such patients are now getting waitlisted for kidney transplantation over recent years.[6] It should be noted that about 78% of patents who underwent KAH and 78% of patients who underwent KALi in our cohort received induction therapy. However, we did not observe a graft or patient survival benefit associated with induction therapy in these patients. These findings are in contrast to the benefits observed in studies comparing IL-2RA vs. no induction,[91011] T-cell depleting vs. no induction[1213] and T-cell depleting vs. IL2-RA induction[14] in KTRs with no previous nonrenal organ transplant. A patient survival benefit was observed with induction even in low immunological risk KTRs in a recent study.[15] The antibody induction conferred cost and outcome benefits among KTRs in an analysis that linked United States Renal Data System with Medicare.[16]
Previous studies have looked at the outcomes of kidney transplantation in patients who had nonrenal organ transplants.[171819] A single-center study found similar 1-year and 3-year patient survival following kidney transplantation among 18 patients who had previous nonrenal organ transplants and 815 patients who underwent kidney transplantation without previous nonrenal organ transplants.[17] A registry analysis involving UNOS database showed reduced 5-year graft survival but similar death-censored graft survivals in KTRs who had previous heart or lung transplant compared to a matched control group of KTRs with no previous nonrenal organ transplant.[18] The waiting list mortality was found to be higher for patients with previous heart, liver, or lung transplant waiting for kidney transplant when compared to other patients on the kidney waiting list in another analysis.[19] A survival benefit was observed in this analysis following kidney transplantation compared to staying on the waiting list in patients with previous heart or liver transplantation but not lung transplantation.[19]
Two previous studies looked at the impact of induction therapy on the outcomes in KTRs with previous nonrenal organ transplants.[2021] In the first single-center study involving 63 KTRs with previous nonrenal solid organ transplants, there was a trend toward increased infection, lower one-year rejection rates, and lower graft and patient survivals among patients who received induction.[20] The larger second study utilized the UNOS database from 1995 to 2009 to evaluate the impact of induction vs. no induction on the outcomes in KTRs with previous heart, lung, or liver transplant.[21] Patient survivals were similar for induction vs. no induction in previous heart or lung transplant recipients but inferior in prior liver transplant recipients who received induction for subsequent kidney transplantation, an effect that was not modified by recipient hepatitis C status. Graft survival was not mentioned. This study did not differentiate between T-cell depleting vs. nondepleting induction with IL2-RA and did not specify maintenance immunosuppression. Our study involves a more recent cohort of patients, who were discharged on more contemporary maintenance immunosuppression with CNI and MPA with the vast majority on steroids.
About 40% of patients in the KALi group in our analysis were HCV-antibody positive. A meta-analysis found the presence of HCV antibody as an independent and significant risk factor for death and graft failure following kidney transplantation.[22] Previous studies have shown variable impact of induction therapy on HCV recurrence in patients undergoing liver transplantation.[2324] A more recent analysis found improved graft and patient survival associated with induction therapy in patients with HCV who underwent liver transplantation.[25] Induction therapy did not negatively impacted patient survival in HCV-antibody positive KTRs in a UNOS registry analysis.[26] We did not do a subgroup analysis to evaluate the impact of induction on the outcomes in HCV-antibody positive KALi group since HCV antibody could represent a false positive result, and can remain positive despite the clearance of the virus naturally or through treatment. The outcomes of HCV-infected transplant recipients have improved significantly due to a paradigm shift in the treatment of HCV infection in recent years with the advent and increasing use of direct acting antiviral therapy. This may partly explain the lack of adverse patient outcomes associated with induction therapy in our study which included a more recent KALi cohort in contrast to an earlier study.[21]
It should be noted that the median PRA was zero in all groups in the current analysis. Hence, it is not possible to exclude the potential benefit of induction in highly sensitized patients. The level of sensitization is generally lower in nonrenal organ recipients awaiting kidney transplantation when compared to patients waiting for repeat kidney transplantation.[19] The increased risk for developing DGF in T-cell depletion–induced patients could be reflective of the practice of preferentially using depleting induction in KTRs who were deemed to be at high risk clinically.
Our study has several limitations inherent to the retrospective design. The relatively small sample size is a limitation. The doses of induction and maintenance agents and the therapeutic drug levels that can impact the outcomes were not available in the database. Maintenance immunosuppression likely might have changes following discharge. Despite using a multivariate analysis, residual confounding can still exist that can potentially impact outcomes. It is possible that the lack of observed differences in outcomes between different induction strategies could be due to appropriate risk stratification by clinicians managing patients and choosing the right induction for the correct patient. The majority of patients in our analysis were on steroid maintenance and hence our results can only be generalized to patients on triple maintenance immunosuppression.
In summary, we did not observe any differences in 5-year graft and patient survivals in previous heart or liver transplant recipients who subsequently underwent kidney transplantation and were discharged on CNI/MPA–based regimen and stratified by the type of induction received for the kidney transplant. The lack of observed graft and patient survival benefits seen with any induction in this population could be related to the risks of enhanced immunosuppression. Clinical trials are needed to confirm the findings of this database analysis.
Financial support and sponsorship
Nil.
Conflicts of interest
There are no conflicts of interest.
Acknowledgements
Presented in part as a poster at the American Transplant Congress 2017, Chicago, IL. The data reported here have been supplied by the United Network for Organ Sharing as the contractor for the Organ Procurement and Transplant Network. The interpretation and reporting of these data are the responsibility of the authors and in no way should be seen as an official policy of or interpretation by OPTN or the US Government.
References
- Chronic renal failure after transplantation of a nonrenal organ. N Engl J Med. 2003;349:931-40.
- [Google Scholar]
- Predictors and evolution of renal function during 9 years following heart transplantation. J Am Soc Nephrol. 2000;11:951-7.
- [Google Scholar]
- Report of the first international liver transplantation society expert panel consensus conference on renal insufficiency in liver transplantation. Liver Transpl. 2009;15:S1-34.
- [Google Scholar]
- The outcome of heart transplant recipients following the development of end-stage renal disease: Analysis of the Canadian organ replacement register (CORR) Am J transplant. 2007;7:461-5.
- [Google Scholar]
- Decreased survival in liver transplant patients requiring chronic dialysis: A Canadian experience. Transplantation. 2008;85:1277-80.
- [Google Scholar]
- An emerging population: Kidney transplant candidates who are placed on the waiting list after liver, heart, and lung transplantation. Clin J Am Soc Nephrol. 2010;5:1881-6.
- [Google Scholar]
- KDIGO clinical practice guideline for the care of kidney transplant recipients. Am J Transplant. 2009;9(Suppl 3):S6-9.
- [Google Scholar]
- Interleukin 2 receptor antagonists for renal transplant recipients: A meta-nalysis of randomized trials. Transplantation. 2004;77:166-76.
- [Google Scholar]
- The impact of IL2ra induction therapy in kidney transplantation using tacrolimus and mycophenolate-based immunosuppression. Transplantation. 2010;90:639-44.
- [Google Scholar]
- Interleukin 2 receptor antagonists for kidney transplant recipients. Cochrane Database Syst Rev. 2010;20:CD00389.
- [Google Scholar]
- Effect of anti-lymphocyte induction therapy on renal allograft survival: A meta-analysis. J Am Soc Nephrol. 1997;8:1771-7.
- [Google Scholar]
- Polyclonal and monoclonal antibodies for induction therapy in kidney transplant recipients. Cochrane Database Syt Rev. 2017;1:CD004759.
- [Google Scholar]
- Thymoglobulin induction study group.Rabbit antithymocyte globulin versus basiliximab in renal transplantation. N Engl J Med. 2006;355:1967-77.
- [Google Scholar]
- Role of induction therapy in low immunological risk-kidney transplant recipients: A mate-kidney analysis. Clin Transplant 2018:e13442. doi: 10.1111/ctr.13442 Online ahead of print
- [Google Scholar]
- Cost effectiveness of antibody based induction therapy in deceased donor kidney transplantation in the United States. Transplantation. 2017;101:1234-41.
- [Google Scholar]
- Renal transplantation following previous heart, liver and lung transplantation: An 8-year single-center experience. Surgery. 2001;130:457-62.
- [Google Scholar]
- Kidney transplantation in previous heart or lung recipients. Am J Transplant. 2009;9:578-5.
- [Google Scholar]
- Wait list death and survival benefit of kidney transplantation among nonrenal transplant recipients. Am J Transplant. 2010;10:2502-11.
- [Google Scholar]
- Should heart, lung, and liver transplant recipients receive immunosuppression induction for kidney transplantation? Clin Transplant. 2010;24:67-72.
- [Google Scholar]
- The influence of induction therapy for kidney transplantation after a non-renal transplant. Clin J Am Soc Nephrol. 2012;7:158-66.
- [Google Scholar]
- Hepatitis C virus antibody status and survival after renal transplantation: Meta-analysis of observational studies. Am J Transplant. 2005;5:1452-61.
- [Google Scholar]
- Induction with rabbit antithymocyte globulin versus induction with corticosteroid in liver transplantation: Effect on recurrent hepatitis C virus infection. Transplantation. 2006;81:620-2.
- [Google Scholar]
- Anti-interleukin-2 receptor therapy in combination with mycophenolate mofetil is associated with more severe hepatitis C recurrence after liver transplantation. Liver Transpl. 2001;7:1064-70.
- [Google Scholar]
- The influence of induction therapy on graft and patient survival in patients with and without hepatitis C after liver transplantation. Am J Transplant. 2010;10:590-601.
- [Google Scholar]
- Effect of immunosuppressive regimen on survival of kidney transplant recipients with hepatitis C. Transplantation. 2008;85:1601-6.
- [Google Scholar]